Start here
Think in three responsibilities
- Make trusted analytics usable for business users
- Keep planning close to shared metrics and decisions
- Expose insight clearly without hiding weak upstream design
SAP Analytics Cloud is where analytics becomes visible to business users. Current SAP material positions SAC as a unified cloud system that brings together business intelligence, augmented analytics, predictive capabilities, and enterprise planning, while broadening natural-language access through Joule and keeping analytics inside the wider Business Data Cloud conversation. That makes SAC strategically important, but it also makes SAC easy to over-assign. SAC works best when teams are clear that it is the business-facing analytics and planning layer, not the whole architecture and not the place where unstable business meaning should be invented on the fly.
SAC is strongest when people need dashboards, exploratory analysis, planning, and guided decision cycles on top of stable models. It is weaker when teams expect the presentation layer to repair semantic confusion underneath.
The cleanest explanation is simple: SAC is the business-facing consumption and planning environment. It should consume governed meaning, not replace the need for it.
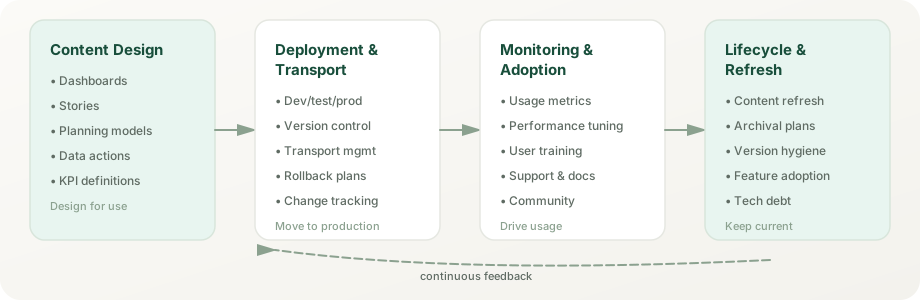
SAC combines analytics consumption and planning in one business-facing surface. The optimized story experience is now the only story experience: SAP deprecated the classic experience at the end of Q2 2026, retiring classic stories and analytic applications. Seamless planning (rolled out during 2025) keeps planning data in SAP Datasphere, Joule analytical insights (since the Q2 2025 release) answer data questions inside Joule, and Smart Predict covers machine-learning forecasting. The Q1 2026 release added story file versions, Pareto and area charts, My Metrics report subscriptions, a live connection to Snowflake, and a fact deletion step for data actions; Q2 2026 added asymmetric reporting, a new data panel, and a live connection to Azure SQL; and the Q3 2026 release brought AI prompt insights, story code generation, Compass simulation results in stories, and Sankey, funnel, and gauge charts. That combination is powerful when teams keep responsibilities clear and do not ask SAC to carry work that belongs in semantic layers or integration.
Expose KPIs, trends, filters, narratives, and guided analysis in a format business users can actually use in recurring decision cycles. The Optimized Story Experience brings responsive, unified design to all story consumption. Stories combine data, text, and interaction so the viewer understands not just what numbers are, but why they matter and what to do next.
Latest: The optimized story experience is now the only story surface. SAP deprecated the classic experience at the end of Q2 2026; since then, classic stories, analytic applications, and classic data analyzer insights are no longer accessible, so remaining classic content had to be converted beforehand (a bulk Story Conversion Tool has been available since the 2024 QRC4 release).
Good use: executive scorecards, management views, operational monitoring, and analytical storytelling that connects insight to business action.
Common mistake: Using stories to hide weak data quality or to patch metric disputes at the presentation layer instead of fixing semantics upstream.
Let users move from static reporting into interactive analysis without needing to understand every modeling layer underneath. Responsive data analyzers, drill paths, and filter-driven discovery turn passive viewing into active problem-solving.
Good use: variance analysis, exception review, trend investigation, and business-user-driven questions against trusted analytic models.
Watch-out: exploratory freedom is valuable, but it still depends on trustworthy underlying semantics and clean dimension hierarchies.
Keep plan inputs, forecasts, scenarios, and modeled assumptions close to the analytics context that informs them. Seamless planning (rolled out during 2025) simplifies planning workflows and reduces friction between analysis and scenario testing. The power is in tightening the feedback loop: teams see current-state insight, design scenarios around it, commit plans, and then return to measure actuals.
Good use: driver-based planning, scenario testing, collaborative what-if analysis, and iterative business planning workflows where realism can be checked against live numbers.
Key requirement: planning only delivers value if assumptions are explicit and if the planning model stays synchronized with the analytics baseline.
Provide a visible surface for alerts, commentary, comparison, collaboration, and increasingly AI-assisted guidance through Joule. Decision support moves beyond reporting: it helps people understand what changed, why it matters, and what options they have.
Latest: Joule analytical insights (since the Q2 2025 release) bring just ask's natural-language answers into Joule. My Metrics (Q4 2025) lets users collect the KPIs they follow from story charts into personal or shared lists, and since Q1 2026 they can subscribe to a scheduled metrics report by email or in-app notification (Q2 2026 added Microsoft Teams as a delivery channel)—shifting from pull-based reporting to push-based insight delivery.
My Metrics use case: A CFO keeps revenue and margin KPIs in one list and receives a weekly metrics report showing what changed. A sales director follows pipeline coverage by region. An operations team tracks supply chain KPIs and jumps from a metric card back to the original story when something moves.
Strengthens when: thresholds are meaningful, alternate views are available for context, and ownership is clear for recommended actions.
Weakens when: decision support still depends on trusted definitions and access control outside the page design itself.
The Q1 2026 release added Pareto and area charts to SAC's visualization library, and the Q3 2026 release added Sankey, funnel, and gauge charts with a quick builder. Pareto charts rank value contributions, ideal for 80/20 analysis in cost, revenue, or quality management; area charts show trend and composition over time; Sankey charts show flows between stages.
Practitioner use: Pareto for top-N customer/product analysis, compliance cost breakdown, or quality defect root cause. Area for revenue trend composition by region or business unit. Funnel for pipeline stages, gauge for a single KPI against its target, and Sankey for flows such as lead source to closed deal.
Build story workflows that allow business users to comment, question, and challenge numbers directly in the analytic surface, on table data cells or in comment widgets. Comments create a visible trail of business conversation around each insight, and AI-assisted commenting can summarize long comment threads, including comments on the members below a table node.
Good use: collaborative review cycles, audit trails for decision commentary, and making invisible agreements visible. Pair comments with calendar review tasks when a planning submission must be discussed before approval.
Use Joule analytical insights and Just Ask to help users frame questions in natural language and get governed answers. Smart Predict builds and compares machine-learning models for forecasting, classification, and regression. This accelerates the path from question to insight but does not eliminate the need for semantic discipline underneath.
Strong fit when: the underlying KPIs are well-defined and the analytical models are well-indexed for discovery.
Many teams underestimate SAC by treating it only as a reporting shell. Its real value is that it can bring analytics, planning, and business action closer together.
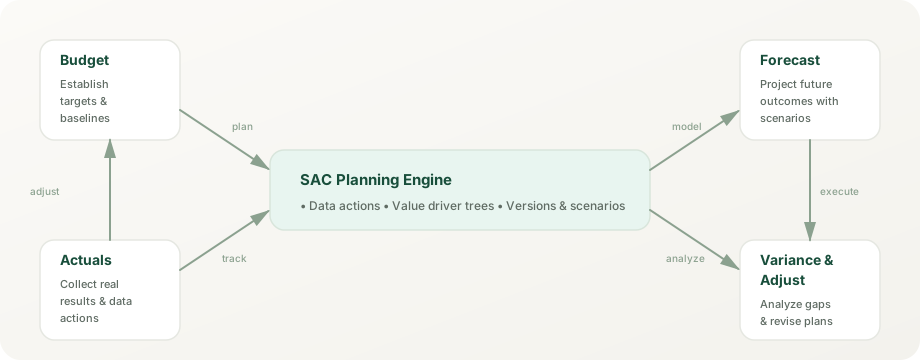
Start from governed KPIs and current-state understanding instead of disconnected spreadsheets. Seamless Planning integrates with SAC analytics for cohesive workflows.
Change assumptions, compare outcomes, and make uncertainty visible before decisions are committed. Smart Predict forecasts can seed assumptions from historical patterns.
Move from analysis to planning and from planning to execution with less rework and less metric drift. Unified narrative context maintains clarity.
Return to the same governed structures to evaluate actuals, explain variance, and improve the next cycle. Collaboration tools make review trails persistent.
Most SAC disappointment comes from asking the consumption layer to fix upstream trust, integration, or governance problems that belong elsewhere. SAC is powerful, but it has clear limits.
SAC can import and wrangle data for its own models, but it is not built to integrate, transform, and manage raw source data across enterprise systems. That work belongs in Datasphere, data engineering, or a managed data foundation. Trying to do it inside stories or data actions creates fragile, unmaintainable logic.
SAC can expose business meaning, but it should not become the hidden place where core KPI definitions are improvised. When definitions live only in local models or calculated fields, they scatter and diverge.
SAC is not designed to replace integration platforms or data-movement services. If data has to be substantially cleansed, joined, or reorganized before use, solve that upstream in Datasphere or integration layers instead of in the presentation tool.
SAC is not the same thing as enterprise data-product management, broad cross-system data engineering, or platform-wide data governance. It is a consumer of governed data, not the producer of it.
Permissions, stewardship, release discipline, and trusted operating rules still need explicit ownership beyond the dashboard layer. SAC enforces access control, but it does not define ownership of business meaning or change approval.
If upstream teams disagree about what a measure means, SAC stories will amplify the confusion rather than resolve it. Semantic clarity must happen before the dashboard design starts.
These myths often distort SAC conversations and lead to wasted effort trying to use the tool for jobs it was not designed for.
Reality: SAC is the consumption and planning layer. It sits on top of semantic and integration work, not instead of it. Teams with weak upstream logic do not fix it by switching to SAC.
Reality: Joule and Just Ask work best when business meaning is already clear, indexed, and consistently defined. AI-generated answers are only as trustworthy as the data they consume. If definitions are fragmented, natural language accelerates wrong answers.
Reality: Polished stories hide the problem rather than solving it. If the underlying numbers are inconsistent, fragmented, or poorly owned, a slick dashboard just makes users trust the wrong thing faster.
Reality: SAC is one modern tool, but modernization also requires semantic clarity, integration discipline, and governance ownership. SAC adoption without those changes usually just moves the old problems into a newer wrapper.
The right choice depends on the real problem. Use SAC when the need is a business-facing decision layer, not when the actual gap sits further upstream.
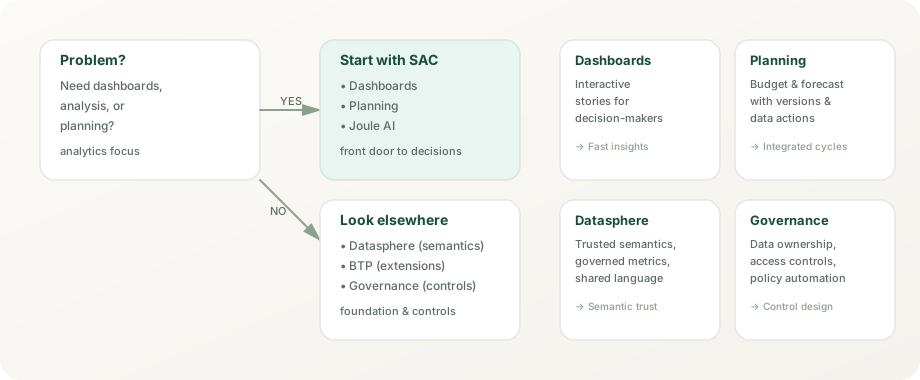
When users need governed dashboards, analysis, planning workflows, and a clear surface for recurring business decisions. SAC's latest features (Optimized Story Experience, Seamless Planning, Joule) are production-ready.
When the analytics surface is needed, but shared semantic logic, reusable models, or trust propagation are still the harder problem. Datasphere provides the semantic backbone SAC consumes.
When the issue is broad enterprise data-product design, large-scale integration, AI runtime engineering, or operating-model control across multiple platforms.
These mistakes create the illusion that SAC is weak when the real problem is usually architecture discipline.
Attractive stories do not compensate for unstable KPI definitions, fragmented dimensions, or unclear business ownership.
Planning features only create value when version control, assumption ownership, and review cadence are explicit.
When too much business logic is buried in presentation or local model choices, maintainability drops and trust erodes.
SAC decisions get messy when teams never define what belongs in Datasphere, BTP, Business Data Cloud, or governance operations.
The same product looks different depending on the role. This page is meant to keep those views aligned instead of forcing one audience to think like another.
Understand SAC as the place where analytics and planning become visible and usable.
Focus on story design, planning structure, performance, reuse, and trusted business-user interaction.
Clarify what belongs in SAC versus semantic modeling, integration, platform extension, and control design.
Judge SAC by decision speed, planning quality, user trust, and operational clarity rather than visual polish alone.
Current SAP product, help, and learning material keeps SAC centered on one business-facing surface that combines analytics and planning, while also making connection choice, natural-language access, content lifecycle, and security design explicit parts of the product story.
Use SAC when business users need stories (with scripting where needed), collaboration, data analyzer workflows, and planning surfaces in one environment instead of across disconnected point tools.
Current SAP guidance still expects teams to choose deliberately between acquired data, live connectivity, and Datasphere-based consumption instead of treating all source access as the same design problem.
Joule, Just Ask, and Joule-linked analytical insights work best when indexed models, business vocabulary, and governed exposure are already prepared. Natural language accelerates consumption; it does not repair semantics.
Roles, licenses, custom-role design, transport choices, Content Network usage, and content governance still determine whether SAC stays usable as adoption grows. Visual quality is only one part of platform maturity.
These sources are the right checkpoint for current feature scope, connection options, natural-language capability, and role design. The interpretation on this page is original, but time-sensitive SAC detail should still be checked against live SAP material.
SAC delivers measurable value when it tightens the link between trusted data and business action. These illustrative scenarios show how teams use SAC to shorten decision cycles, unify planning, and speed up close and review cycles.
A mid-size manufacturer was closing the books in a fragmented way: actuals in one system, forecast in spreadsheets, and plan assumptions scattered across email. Every month-end started with days of reconciliation.
Sales leadership was pulling pipeline data from Salesforce manually, combining it with SAP actuals, and then asking questions that took days to answer. Opportunity stages were not consistently defined across regions.
The executive team was receiving static board packs that took weeks to prepare. Questions that arose in meetings could not be answered until the next reporting cycle.
Stories are the primary analytical narrative surface in SAC. They combine data visualizations, text commentary, filters, and guided interactivity into a cohesive user experience. The optimized story experience, now the only story experience, unifies story design with the scripting that used to require separate analytic applications, and its responsive pages adapt across desktop, tablet, and mobile devices without separate versions. With classic stories and analytic applications retired at the end of Q2 2026, it is the only design path.
Responsive pages group widgets in lanes that reflow to the screen width, so one story can serve desktop, tablet, and phone viewers without separate page variants; canvas pages allow free-form positioning when a layout must be exact. A single story serves all consumers, reducing content duplication and keeping views consistent.
Design tip: Choose the page type per page: responsive for dashboards that must work on phones, canvas for exact layouts such as board views, and test both on the devices your audience actually uses.
Author benefit: Design once, publish everywhere. Analytics teams can focus on insight quality rather than layout maintenance.
Since the Q1 2026 release, designers can save versions of an optimized story, review them later, restore an earlier version, or delete versions they no longer need. That gives teams a safety net for redesigns and quick rollbacks without keeping copies of the story.
Use case: Before restructuring a monthly close story, save a version; if users reject the new layout, restore the previous one instead of rebuilding it.
Governance benefit: Versions make story changes reversible, but they do not replace transports between development and production tenants.
Story themes capture fonts, colors, and widget styling so a team can apply one corporate look across stories, and optimized stories also accept custom CSS for finer control. A shared theme works like a small design system for the team's stories.
Practical rule: Keep brand styling in a shared theme rather than formatting widgets one by one, and reserve custom CSS for the few cases a theme cannot cover.
Stories can link to each other through cross-story navigation, allowing users to follow guided analytical paths. A sales overview story can link to regional detail stories, which link to customer account stories, creating a drill-through experience without requiring separate applications or complex navigation logic.
Common pattern: Dashboard → Trend Detail → Root Cause Analysis → Recommended Action. Each story is self-contained but discoverable through thoughtful linking.
Analytic applications retired with the classic experience. In optimized stories, designers build with standard widgets and filters, while developers (users with the Application privilege) switch on advanced mode for scripting, containers and popups, custom widgets, and composites, all inside the same story.
Decision rule: If the experience can be achieved with standard widgets, filters, and data analyzer, keep the story script-free. Add scripting only when custom interaction, event handling, or non-standard data flow is required.
High adoption of stories depends on fast load times, intuitive navigation, and clear value communication. SAP's story performance guidance includes avoiding charts with more than 500 data points, applying Top N, preferring drill-down over many simultaneous visualizations, and using background or viewport loading in optimized stories; the Performance Insights tool shows load statistics and recommendations. Usage data then guides iterative story improvement.
Joule, SAP's generative AI assistant, and SAC's own natural-language features work together. Just ask (generally available since Q1 2024) answers typed business questions inside SAC; since the Q2 2025 release, Joule's analytical insights use just ask to answer the same kind of question from Joule. Joule Studio, an SAP Build capability rather than an SAC feature, is where teams build custom Joule skills and agents.
Users type business questions, and just ask answers with simple charts and tables from acquired SAC models or SAP Datasphere models that administrators have added to its index. The search field auto-completes measure names, dimension names, and members, and admins can define synonyms; results can go into a story, be exported to CSV or Excel, or be explored further in data analyzer.
Example workflow: "Show me revenue by product category for the last 12 months" → just ask matches the revenue measure, the product category dimension, and the time filter → returns a chart for the period.
Technical requirement: Models must be indexed with clear business-friendly naming. Ambiguous dimension names or poorly labeled measures reduce accuracy.
Just ask maps the terms in a question to indexed model objects (measures, dimensions, and members), builds the query, and shows the result as a chart or table, with optional generated AI explanations of what the result means. A readiness check tells admins whether a model is prepared for just ask and Joule analytical insights.
Availability: Tenants hosted on Cloud Foundry (AWS), Google Cloud, or Microsoft Azure; not on Neo or Alibaba Cloud.
Limitations: Calculations that are not in the model, ambiguous business terms, and models that were never indexed limit what it can answer.
Analytical insights bring just ask into Joule: users ask a data question in Joule, from SAP Build Work Zone or another SAP application, and get a chart-backed answer from indexed SAC or Datasphere models without opening a dashboard. It has been available since the Q2 2025 release, needs a Joule entitlement, SAP Build Work Zone, and an SAC Enterprise license, and is included with Joule Base.
Example: A sales manager asks Joule for last quarter's revenue by region, gets the answer as a chart in the flow of work, and opens the full story only to drill further.
Joule Studio lives in SAP Build, not in SAC: teams build custom Joule skills (generally available since July 2025) and agents (since December 2025) with low-code tools, grounded in business data and context. The managed next generation announced at SAP Sapphire 2026 is rolling out in phases.
Use case: A supply chain team builds an agent that answers questions about "inventory by SKU," "lead time variance," and "supplier performance" from governed data, and points users to the right SAC story for detail.
Benefit: Grounding agents in governed models and data products narrows the question space and reduces wrong answers.
SAC's AI-assisted features work inside the designers: AI prompt insights widgets (Q3 2026) combine planning-data analysis with web search through a large language model, story code generation drafts scripts from a prompt, AI-assisted calculations generate or explain formulas in data analyzer, and for planners, AI-assisted data actions draft advanced-formula scripts and generate data action documentation. Administrators must enable these features, and some require SAP AI units.
Joule queries only work as well as the underlying semantic model. Clean dimension hierarchies, consistent naming conventions, documented business metrics, and appropriate access controls must exist. Natural language does not repair fragmented or poorly defined metrics.
SAC planning has evolved from simple what-if scenario testing into an integrated planning layer. Seamless planning (rolled out during 2025) stores a planning model's data in an SAP Datasphere space, so plans sit next to the actuals and analytic models that inform them; other planning models keep their data in SAC. Either way, versions and data actions keep plans connected to the analytics baseline.
Traditional planning separates analysis from planning: analysts examine data, then planners input assumptions in separate workflows. Seamless planning narrows that gap. A seamless planning model's facts and master data live in a Datasphere space, so Datasphere views and analytic models can combine plan data with actuals and other data products without exporting plans first. A user can analyze Q4 actuals and design a Q1 scenario in the same model context.
Live data: Since the Q4 2025 release, seamless planning models can add external live versions that read Datasphere fact views at runtime, such as actuals or a prior forecast, without replicating them into the model.
Planning models organize actuals, budgets, forecasts, and scenarios as versions. Public versions are shared with everyone who has access; private versions let a planner build a scenario on their own and publish the changes to a public version when ready. The version management panel in a story shows the versions in play and handles copying and publishing.
Workflow example: A team copies the Q1 budget into private versions for a 10% headcount reduction and a conservative revenue case, compares them side by side in a story, and publishes the agreed scenario.
Live versions bring read-only fact data from an external source into a model without replication. Seamless planning models read Datasphere fact views (since Q4 2025); other models use live SQL sources such as Google BigQuery, Snowflake (since Q1 2026), and Azure SQL (since Q2 2026) through the data access agent. Planners use live data as a read-only actuals baseline in stories, calculations, and data actions, and can copy it into planning versions, but nothing is written back to the source.
Workflow example: Actuals arrive as a live version from Datasphere; a data action copies them into the forecast version as the starting point, and variance analysis compares the forecast against live actuals.
Data actions run planning logic (copy, allocation, and advanced formulas) on planning model data; for seamless planning models, that data sits in Datasphere. Planners input assumptions (headcount, price per unit, marketing spend), and the configured logic calculates dependent metrics. The Q1 2026 release added a fact deletion step that deletes facts, deletes zero values, or sets values to zero, which is useful for clearing a version before replanning.
Common flow: User enters "5% price increase" → data action recalculates revenue and margin → user reviews the scenario outcome before publishing. For correction workflows: a fact deletion step clears the affected data → the next data action rebuilds it from clean inputs.
Governance: Running a fact deletion step needs the Maintain permission on the model, and the Q3 2026 data filter parameters let one data action be reused across different data slices.
Complex planning often requires distributing a total across dimensions (top-down allocation) or building up from detailed assumptions (bottom-up aggregation). SAC supports both through allocation steps. Multi-currency planning converts inputs and outputs to reporting currencies with rates from a currency conversion table, while keeping the local-currency values.
Example: A global company plans revenue in local currency (EUR, GBP, JPY) but needs group reporting in USD. SAC applies the exchange rates and reports both local and converted views.
Smart Predict integration within planning allows teams to start plan assumptions from ML-generated forecasts rather than flat guesses. The system analyzes historical actuals, identifies seasonality and trends, and suggests initial plan values. Planners then adjust these forecasts with business knowledge (new campaign impact, market changes, capacity constraints).
Benefit: Reduces planning bias and anchors assumptions to data rather than intuition.
SAC's calendar orchestrates planning processes: input and review tasks route to owners and approvers, who can approve or reject a submission and send it back to the originator. Process status is visible to the wider team, and data locking can freeze approved data so it cannot be changed after sign-off.
SAC's built-in machine learning answers different analytical questions: Smart Predict (classification, regression, and time-series forecasting through predictive scenarios), Smart Insights (what drives a value or a variance), and Smart Grouping (clustering points in bubble and scatterplot charts). Smart Discovery, which ran on the classic experience, was phased out with it.
A time-series predictive scenario is a workspace where you train one or several forecasting models on historical data, compare their quality indicators, and apply the best one. You specify the target measure, the date dimension, and optional influencers such as holiday months or seasons, and Smart Predict returns forecasts for the chosen horizon.
Use cases: Revenue forecasting, demand planning, headcount projection, cash flow prediction.
Advantage: No statistical expertise required. The system detects trend and seasonality automatically.
Limitation: Requires enough history to learn trend and seasonality, and assumes past patterns persist. Works poorly during structural breaks or unprecedented market shifts.
Beyond forecasting, Smart Predict also builds classification models. Given historical data with known outcomes, the system trains models that predict how likely an outcome is. Common use: predict customer churn, deal win probability, or invoice payment status.
Workflow: Point the scenario at training data with known outcomes and choose the target and influencers → Smart Predict trains and compares models → apply the best one to new records and use the results in models and stories for segmentation or filtering.
Smart Discovery analyzed how underlying variables influence a chosen measure or dimension and generated its results as a classic story. It was built on the classic experience and was phased out with it (SAP KBA 3728399).
What to use instead: Smart Insights to explain values and variances, just ask or data analyzer for ad-hoc questions, Smart Predict to see which influencers drive a target, and Compass for what-if simulation, whose results can appear in stories since the Q3 2026 release.
Given a value or a variance, Smart Insights ranks the dimensions and members that contribute most and explains them in plain language. Instead of users manually drilling through each dimension, it surfaces, for example, that one product category in one region accounts for most of a plan-versus-actual gap. Recent releases extended it from acquired data and live SAP HANA to stories on SAP Datasphere and seamless planning models.
Benefit: Speeds up root-cause analysis.
Smart Grouping clusters the data points in bubble and scatterplot charts (correlation analysis) into groups with similar values, using a centroid-based clustering algorithm. The designer sets the number of groups, the group label, and whether tooltip measures count, and scripts can let viewers change these settings. Common use: customer segmentation by purchasing behavior or product clustering by performance profile.
Output: The groups color the chart; if segments must persist for later analysis, model them as a dimension upstream (for example in Datasphere) instead of expecting SAC to write them back.
Use Smart Predict when predicting future values or unknown outcomes. Use Smart Insights when explaining a value or a known variance. Use Smart Grouping when segmenting points in a correlation chart. Use just ask or Joule analytical insights for ad-hoc questions in natural language. Mature analytics environments use several of these as different analytical questions arise.
Since the classic experience ended, application-style development happens inside optimized stories. Advanced mode adds the scripting API, containers and popups, custom widgets, and composites, giving programmatic control over layout, interaction, and data flow for multi-step workflows or interaction patterns that standard story features cannot express.
The SAC scripting API (JavaScript-based) provides access to data sources, widget properties, and events. Scripts respond to user actions in ways standard story features cannot: conditional navigation, showing and hiding content, setting filters and variables across widgets, or triggering data actions for planners. Since the Q3 2026 release, AI-assisted story code generation drafts scripts in the script editor from a natural-language prompt.
Example application: A what-if simulator where users adjust 20 input assumptions simultaneously, see real-time output updates, and export scenarios for stakeholder review. This level of interactivity and responsiveness requires scripting.
Custom widgets extend SAC's built-in widget library with developer-built web components, and custom add-ons extend the built-in widgets themselves. With data binding, designers can configure a custom widget like a standard chart without writing scripts. Now that SAC has native Sankey, funnel, and gauge charts (Q3 2026), reserve custom widgets for visuals it still lacks, such as specialized network or timeline diagrams.
Development approach: Build custom widgets with web standards (for example SVG or Canvas inside a web component) and treat them as code: someone has to own testing and updates after each SAC release.
Composites are reusable building blocks for optimized stories (available since the 2023 QRC4 release): a designer packages widgets, configured data, and scripts once, defines interface functions and events, and story authors import the composite into many stories. Typical composites are a corporate header or footer, a navigation menu, a standard dialog, or a predefined chart; they are saved in the file repository and can be transported between tenants.
Stay with standard story features when built-in visualizations, filters, and interactivity are enough. Add scripting, custom widgets, or composites when custom control, programmatic behavior, or non-standard interaction patterns are required. Keep most content script-free: every script and custom widget adds maintenance that someone has to own.
SAC's analytical capability depends entirely on the quality and architecture of the data feeding it. Models can source data in two fundamentally different ways: live connections and acquired data, each with distinct tradeoffs in freshness, governance, and performance.
Live connections query source systems on demand. For SAP sources (SAP Datasphere, SAP HANA, SAP S/4HANA, SAP BW/4HANA, SAP BPC embedded, SAP Integrated Business Planning, and universes), SAC builds live models whose data and structure stay in the source. For SQL sources (Google BigQuery, Snowflake since Q1 2026, and Azure SQL since Q2 2026), live data access keeps the model structure in SAC and reads fact data at runtime as read-only live versions, through the data access agent on tenants running on SAP HANA Cloud. In a planning model, a Snowflake live version can serve as the read-only actuals baseline for data actions, version copies, and what-if analysis, while plan data is still written to SAC's own planning versions, not back to Snowflake.
Best for: Organizations operating on Snowflake or BigQuery as a central data platform who want a unified analytics and planning experience, using the warehouse as the live actuals source without replicating that baseline into SAP first.
Practitioner implication: It removes replication of the actuals baseline, not the SAC planning store itself. SAP currently advises against live access to Snowflake tables above one million rows, and SAC reads regular Snowflake views, not semantic views.
Performance consideration: Every SAC view triggers a source query. High concurrent users or complex queries can overload source systems. Caching and query optimization are critical at scale.
Acquired data is extracted from sources on a schedule (hourly, daily, weekly) and imported into SAC's internal analytics engine. Queries run against local copies, delivering fast response times and reducing source system load. The tradeoff is latency: acquired data is never fresher than the last import cycle.
Best for: Reporting on historical data, complex analytical models where performance matters more than real-time freshness, and consolidations that combine data from many sources.
Data scheduling: Import jobs run on demand or on a schedule. Someone has to watch for failed jobs and rerun them once the source issue is fixed, because a silent failure leaves stories showing stale numbers.
Modern analytics requires combining data from many sources: ERP actuals from SAP, market data from external feeds, sales from Salesforce, HR from SuccessFactors. Stories can blend several models by linking shared dimensions, including combinations of acquired and live models (blending support varies by live source). A story might link live HANA revenue with imported market-share data and a Salesforce pipeline imported on a schedule.
Semantic requirement: Blending depends on shared dimensions (date, customer, product, region). If dimensions are named differently across sources, linking them requires explicit mappings or transformation.
SAC includes lightweight data wrangling: filtering, concatenation, reshaping, and calculated field creation. For simple data preparation, wrangling inside SAC is acceptable. For complex transformation logic (aggregation rules, categorization, hierarchy building), use Datasphere's data transformation engine instead. SAC wrangling should remain opportunistic, not foundational.
Organize models by business domain (Sales, Finance, Supply Chain) rather than by source system. A Sales model should combine ERP order data, Salesforce pipeline, and marketing spend regardless of origin. Reuse common dimensions (calendar, customer, product, organization) across all models. Document assumption and calculation logic at the model level, not buried in stories. Version models and track changes as you would code.
SAC can be embedded directly into other SAP applications, creating analytics experiences within familiar workflows. Embedding strengthens adoption by reducing context switching and placing insights where decisions are made.
SAC stories can be added to an SAP Fiori launchpad as tiles, appearing alongside transactional applications. Users open a planning story or sales dashboard from the same launchpad they use for purchase order entry or invoice approval, and the tiles are set up in launchpad administration rather than coded.
SAC content can be integrated into SAP Build Work Zone (standard edition, formerly SAP Launchpad service; advanced edition, formerly SAP Work Zone), which gives employees one entry point for cloud and on-premise content: SAC stories and planning surfaces alongside HR self-service, expense reports, and other business applications. Work Zone is also a prerequisite for Joule analytical insights.
Stories in SAP SuccessFactors People Analytics (released in 2020 and available to SuccessFactors customers at no extra cost) run on an embedded SAP Analytics Cloud, so HR teams build and view workforce reports on live SuccessFactors data inside the HR suite, without navigating to a separate tool.
SAP Sales Cloud and SAP Service Cloud Version 2 deliver standard stories through SAP Analytics Cloud, embedded edition, so sales and service teams see pipeline and case analytics without leaving the CX application. Embedding brings analytics into moment-of-decision contexts.
Embedding options range from simple links (story URLs with parameters to open a page or pass filter values), to iFrame embedding of stories in other web applications, to the embedded editions that SAP builds into its own cloud applications. Links are simplest; iFrame embedding needs single sign-on between the host application and SAC so users are not asked to log in twice; embedded editions are delivered by SAP rather than built by customers.
As SAC adoption scales, administration becomes critical. Governance includes user management, role-based access control, content lifecycle management, and transport discipline across development, quality, and production environments.
SAC is delivered as a SaaS cloud service. Each customer works in its own tenants, typically at least one development or test tenant plus production, while SAP runs the infrastructure and ships updates on a quarterly release cycle. Customer administrators handle user provisioning, license and role assignment, and content lifecycle; Content Network transports only work between tenants hosted in the same data center, so plan the landscape with that in mind.
SAC ships standard application roles, such as Viewer, BI Content Viewer, BI Content Creator, Modeler, Planner Reporter, BI Admin, Admin, and System Owner, and which ones appear depends on the licenses in the subscription (Business Intelligence, Planning Standard, Planning Professional, and embedded or concurrent-session variants). Use them as templates for custom roles with fine-grained permissions. User and team assignment is usually automated from the identity provider: SAML single sign-on plus SCIM-based provisioning, for example through SAP Cloud Identity Services.
Stories, models, and planning content are shared with users or teams at defined access levels, and folder permissions determine who can view, edit, or administer content. Ownership matters: give every important story and model a named owner responsible for currency and correctness, and plan who takes over before an owner leaves so content does not become orphaned.
Content Network storage moves packaged stories, models, and other objects between tenants (development → quality → production), and SAP also delivers business content through the Content Network. Packages can include the objects a story depends on; transports through the Content Network work only between tenants in the same data center, with file-system export and import as the fallback. Story file versions help with quick rollbacks but do not replace this transport discipline.
Administration overview cards on the home screen (Q1 2026) summarize tenant health, user and license usage, performance hotspots, and governance signals. The Performance Insights tool explains slow stories with load statistics and recommendations, and the activities log records who changed what. Together they help administrators find slow stories and queries and understand usage patterns.
SAC operates in a crowded analytics market. Each platform has distinct strengths. An honest assessment helps organizations choose based on specific requirements rather than marketing claims.
Power BI strength: Cost, ease of use, rapid dashboard creation, Excel integration. Analysts can publish dashboards in hours.
SAC strength: Integrated planning, native SAP data access, Joule AI, story-based narratives. SAC is stronger for organizations needing planning and analytics unified.
SAC advantage in: Planning workflows, SAP ecosystem fit, Joule natural language, cost for large planning teams.
Power BI advantage in: Visualization breadth, broader database support, lower entry cost for pure analytics.
Honest assessment: If planning is secondary, Power BI may offer faster ROI. If planning is strategic, SAC's integrated approach reduces total cost of ownership.
Tableau strength: Visualization capability, artistic dashboard design, large ecosystem of developers and consultants, strong community.
SAC strength: Integrated planning, SAP native, Datasphere integration, lower skill-to-value ratio for SAP customers.
Where SAC wins: Organizations deeply invested in SAP who need planning. Organizations comfortable with simpler, more structured storytelling.
Where Tableau wins: Organizations valuing design flexibility, those with multi-cloud data sources, those with Tableau expertise already in-house.
Looker strength: Data modeling philosophy (metrics defined in code), strong semantic layer, tight Google Cloud integration.
SAC strength: UI-based modeling, integrated planning, SAP native, Joule AI.
Differentiation: Looker emphasizes modeling rigor; SAC emphasizes business-user accessibility and planning. They serve different customer profiles.
Planning integrated with analytics is rare. Most competitors treat planning as a separate module. SAC's unified approach eliminates context switching and keeps assumptions tied to baseline data. Joule natural language access is increasingly competitive. SAP ecosystem integration is unmatched for S/4HANA, Datasphere, and BTP users. Total cost of ownership for SAP customers with planning requirements typically favors SAC.
Visualization breadth lags Tableau. Looker's code-first semantic modeling appeals to data engineers more than SAC's UI-based approach. Power BI's cost and ease of use are hard to match for pure analytics use cases. SAC has smaller consultant and developer ecosystem than Power BI or Tableau.
SAC licensing changed in 2026. Inside a tenant, license types are still user-based, but for new purchases SAP's pricing pages route SAC through SAP Business Data Cloud core capacity, and since January 1, 2026, SAC and Datasphere are no longer eligible services for new BTPEA, CPEA, or pay-as-you-go subscriptions.
Every user consumes one license type, determined by their roles: Business Intelligence (also available as concurrent sessions or as an embedded variant), Planning Standard, or Planning Professional, with Analytics Hub as an add-on. Only Business Intelligence licenses can be concurrent, and the system owner consumes no license.
Pricing: Prices depend on the contract, so this guide does not quote figures; size licenses by role mix, not headcount alone.
Use case fit: Organizations with stable, predictable user populations. Costs are predictable but scale linearly with headcount.
For new contracts, SAP sells SAC as a capacity service of SAP Business Data Cloud, licensed through BDC core capacity measured in capacity units and sized with SAP's BDC Estimator. Customers that ran SAC on BTPEA, CPEA, or pay-as-you-go credits could use them until their agreements ended (no renewal after December 31, 2025), and existing tenants can be rewired to BDC without a technical migration.
Planning tip: Size BDC capacity against actual workloads across SAC, Datasphere, and the other BDC services you plan to use, not against SAC alone.
Planning implementation typically requires services (data modeling, workflow design, training). Budget planning-specific services separately; timelines depend on model complexity, process scope, and data readiness. SAC licensing itself is often secondary to implementation cost and ongoing support.
Direct SAC licensing is only part of cost. Include: infrastructure (Datasphere or data warehouse), integration services, implementation and training, ongoing support and evolution. Model all of them over a multi-year horizon rather than comparing license prices alone.
As adoption grows and data volumes increase, performance becomes critical. Well-designed models and optimized queries ensure that dashboards remain responsive and expensive queries do not cascade into system slowdowns.
Model design directly affects query performance. For live sources, star schemas, pre-aggregated views, and well-partitioned large tables in the source (SAP HANA, Datasphere, or SAP BW) keep queries fast. In SAC, keep models lean, with only the dimensions and measures stories need, and push heavy calculations upstream rather than into story-level formulas.
SAC speeds up repeat views with a few specific mechanisms rather than tunable cache lifetimes: progressive chart rendering (an administrator setting) shows charts faster when a story is reopened within an hour, optimized view mode caches previously visited pages, query batching combines widget requests, and live SAP Datasphere queries use Datasphere's InA/MDS cache, which is on by default. Fix slow queries at the source rather than relying on caches.
Each data-bound widget sends its own queries, so crowded pages load slowly. Keep overview pages to a handful of key KPIs and move detail to further pages, avoid charts with more than 500 data points, and in optimized stories use background or viewport loading so widgets that are not yet visible load later. The Performance Insights tool includes recommendations on widget counts.
Forecast concurrent users at peak times (month-end reporting, quarterly planning). Design data models and query patterns assuming peak load, not average load. Test with load tools. Consider geographic distribution of user load: morning in Europe, afternoon in Americas. Stagger heavy workloads to smooth system demand.
Use the Performance Insights tool and the administration cards to identify slow queries and the slowest stories. Optimize high-impact items first. Slow queries affecting 100 users matter more than slow queries affecting 3. Iterate: measure, identify, optimize, repeat quarterly.
SAC's architecture can be visualized as four integrated layers: consumption surfaces (stories with scripting, planning, embedding, Joule), analytical and planning engines with smart features, AI and intelligence, and data connectivity. Understanding this layering clarifies design boundaries and integration decisions.
Sapphire 2026. At SAP Sapphire 2026 in May, SAP announced Joule Agents in SAP Business Data Cloud that generate SAP Analytics Cloud stories from data models, queries, and business context — then let users drill into KPIs, drivers, and trends conversationally — alongside natural-language insights across governed data products. SAP announced these agentic capabilities in private preview, so check availability for your tenant; separately, the Q3 2026 release brought AI prompt insights and story code generation to SAC. Read the full analytics-lens analysis →