Start here
Think in four ownership tests
- Who owns access and role boundaries?
- Who owns semantic change and KPI meaning?
- Who approves release and exceptions?
- Who monitors trust and restores it after failure?
Governance in SAP analytics is the operating system for trust. It decides who owns access, who owns shared business meaning, who approves release, who monitors live use, and who restores trust when something goes wrong. Current SAP help content makes this more tangible than a policy slide ever can: SAC role templates and custom roles, Datasphere spaces and data access controls, and Business Data Cloud cockpit administration all prove that security and administration are part of the operating model, but not the whole model. Mature analytics teams do not treat governance as policy text around the edges. They treat it as the control model that keeps SAC, Datasphere, planning, integrations, catalog synchronization, AI-assisted workflows, and 2026 developments (SAP Reltio in SAP Business Data Cloud for master data, data product governance in BDC, EU AI Cloud sovereignty options, SAP AI Agent Hub and Joule guardrails) usable at scale across both SAP and non-SAP systems.
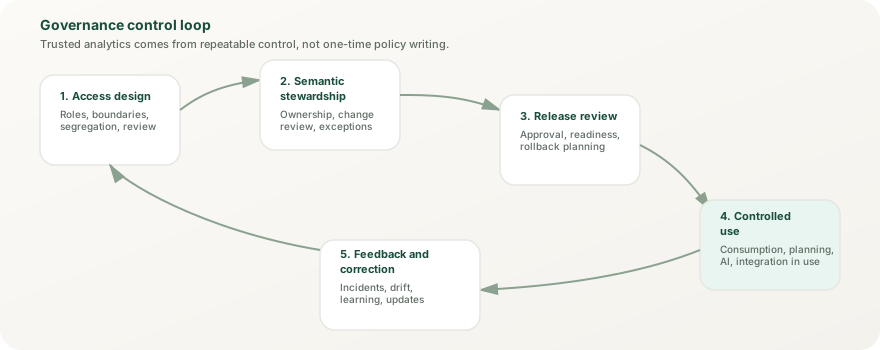
This topic is strongest when dashboards, planning models, data products, or AI-assisted outputs feel unstable because ownership, control, or approval logic is unclear. It is weaker when the root problem is purely front-end design or semantic architecture.
Control ownership, access boundaries, semantic stewardship, release discipline, monitored use, and issue recovery across SAP plus non-SAP analytics routes.
Architecture decisions, semantic model design, integration pattern design, or a clear analytics product strategy.
A system where change can happen safely without degrading trust every time the estate expands.
Governance is enforced through concrete product controls across five layers: identity authentication, platform administration, data access, content permissions, and audit logging. Each layer has specific responsibilities and enforcement points.
Governance is the layer that keeps platform capability, business meaning, and operational accountability from collapsing into one blurred role. It is broader than administration and more practical than abstract policy.
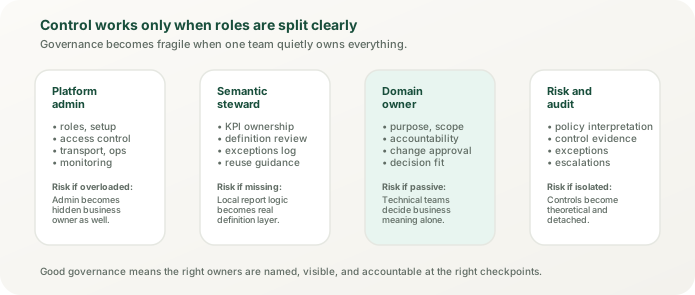
Own tenants, spaces, technical permissions, transport or promotion setup, and operational settings that keep the estate runnable.
Own KPI logic, business definitions, dimension meaning, and the review of changes that would otherwise create silent metric drift.
Own whether a dashboard, model, planning process, or AI-assisted output is acceptable for real business use.
Own exception handling, incident response, auditability, and the correction path when trusted output stops being trustworthy.
A strong control model reduces ambiguity. It shows who decides, who approves, what gets monitored, and how the team reacts before trust damage spreads.
Define role patterns, permission boundaries, sensitive-data handling, and review cadence so users can act safely without uncontrolled sprawl.
Good use: space ownership, role-based access, approval for privileged actions, periodic access review.
Keep shared KPIs, entities, hierarchies, and planning logic stable through named ownership and visible review of changes.
Good use: steward-led change review, metric glossary alignment, documented exceptions.
Decide how models, stories, data products, integrations, and AI-assisted outputs move from draft to trusted business use.
Good use: readiness criteria, rollback thinking, traceable approval, controlled promotion.
Define who investigates trust failures, who restores service or accuracy, and how the same problem is prevented from recurring.
Watch-out: no recovery owner usually means governance is decorative rather than real.
SAP Joule and AI-assisted analytics recommendations increase the governance surface because outputs influence business decisions without always showing their reasoning. Governance must now own: which data Joule can access and use for recommendations, how AI training or grounding decisions are reviewed, who validates AI-generated insights before publication, whether recommendations are auditable and explainable, and what happens when AI-assisted output later proves incorrect or biased. SAP's own tooling now helps: SAP AI Agent Hub (generally available since May 2026, built on SAP LeanIX) registers agents, MCP servers, and LLMs across vendors and keeps unverified agents out of production.
Good use: approval gates for intelligent content and agents, impact assessment for generative outputs, lineage tracking for AI recommendations, responsible AI review checklist, data provenance for training datasets.
Teams often write policy after go-live. That is backwards. The strongest governance is visible at the moments that shape trust: request intake, design review, release approval, live monitoring, and issue correction.
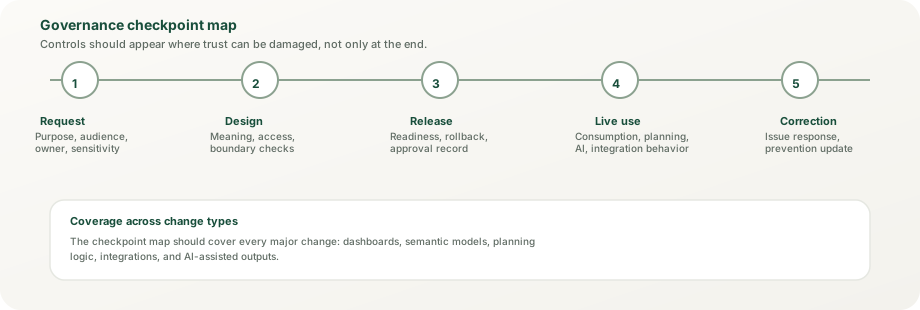
Clarify owner, audience, sensitivity, business consequence, and whether the request changes meaning, access, or both.
Check semantic impact, access implications, platform boundary fit, and whether exception paths are already emerging.
Confirm readiness, approvals, rollback thinking, and the named owner of post-release trust before publication.
Monitor access drift, semantic drift, workflow breakage, and user-reported trust failure so issues are corrected before they normalize.
Most control failure does not come from a total absence of policy. It comes from an operating model that looks official but is too vague to guide live behavior. These patterns are common across large analytics programs because they feel efficient until they suddenly are not.
When platform admin becomes the fallback owner for semantics, release approval, and business exceptions, speed initially looks high but trust decays fast. The hero becomes a bottleneck, decisions stay in their head, and the day that admin leaves, the operating model collapses with them. Modern analytics cannot depend on heroic individuals holding the system together.
KPI logic, hierarchies, and planning assumptions shift in private channels, in local models, or in responsive data analyzers, and the live analytic surface slowly stops matching business memory. Users notice the drift but assume it is them misremembering, not the metric changing. Silent semantic drift is trust poison.
Temporary permission fixes, manual overrides, documented-as-temporary workarounds, and untracked adjustments accumulate until the documented control model no longer matches reality. The people managing the exceptions know what is really happening, but that knowledge is not written anywhere. When one of them leaves, the exceptions become invisible.
Teams add natural language, AI-assisted analysis, new integrations with Salesforce or Collibra, or workflow-driven action without rethinking ownership, approval, and monitoring. New capabilities increase the trust surface, and if governance does not grow with them, trust becomes fragile exactly when the platform becomes more ambitious.
Teams define who has which permissions, but nobody defines what approval is required before publishing, changing, or exposing a dashboard or data product. Permission is not the same as approval. Governance fails when everyone can technically do something but nobody knows whether they should.
Teams track KPI changes, access patterns, and data quality, but nobody has the authority or process to correct problems when they are detected. Alerts without correction create false confidence: the team thinks they are in control because they are watching, but they are actually just watching problems accumulate.
If the semantic layer is misplaced or integration paths are fragmented, governance exposes the problem faster but cannot remove the design flaw.
Security matters, but governance also includes meaning ownership, release discipline, monitored use, and correction logic.
Detached policy language is not control. Governance has to remain connected to live SAC, Datasphere, integration, planning, and AI operating choices.
The hardest projects are often misdiagnosed. This decision path helps separate control failure from semantic design, runtime architecture, or integration design failure.
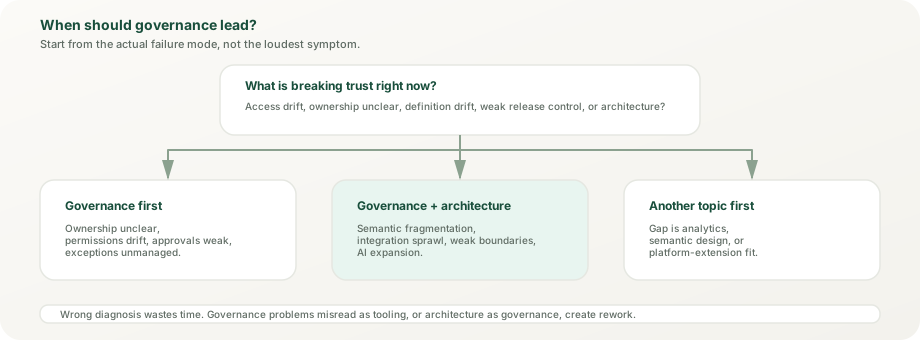
When ownership is unclear, approvals are inconsistent, permissions drift, or trusted output is being weakened by a missing operating model.
When trust issues are caused by semantic fragmentation, uncontrolled integration patterns, or unclear platform boundaries across several systems.
When the real need is a semantic foundation, analytics experience design, or extension strategy rather than a control-model redesign.
The same control model should answer different questions for each audience without becoming four disconnected narratives.
See governance as the rule-and-owner system that keeps analytics from feeling arbitrary or contradictory.
Focus on permissions, change review, release readiness, and what actually happens when an exception or trust defect appears.
Clarify where control boundaries sit across SAC, Datasphere, integrations, planning, and AI-assisted outputs.
Judge governance by whether safe change becomes faster, risk becomes more visible, and trusted analytics stays stable as adoption expands.
Every new planning surface, integration path, semantic layer, or AI-assisted workflow increases the trust surface. Growth without control redesign usually creates invisible risk before it creates visible value.
Current SAP help material shows that governance is implemented through concrete product controls. The right enterprise-architecture reading is to connect those controls into one operating model instead of treating each product admin screen as an isolated responsibility.
SAP guidance for SAC still treats standard roles as templates for custom roles. That matters because business-facing analytics security should reflect job design, not only technical access.
Spaces, scoped privileges, permissions entities, and data access controls define who can model, expose, and consume data. Those are governance boundaries, not only setup tasks.
Glossary terms, catalog assets, and lineage-oriented controls matter because they anchor shared meaning. Governance fails when they are treated as optional metadata decoration.
Business Data Cloud adds user and role management, activity tracking, system configuration, installation of intelligent content (formerly intelligent applications), and landscape monitoring. Governance has to grow with that larger operating surface.
These sources are the best current baseline for how SAP products expose real governance controls. They are not a substitute for architecture judgment, but they are the right source of truth for product behavior.
Datasphere security is built on spaces as isolation units and scoped roles that grant privilege at both space and object levels. This model allows enterprises to design security boundaries that match organizational structure while keeping the semantic layer unified.
A space is both a logical container for related data assets and a security boundary. Users can be assigned to multiple spaces, but permissions in one space do not translate to access in another. Enterprise-scale governance uses spaces to enforce line-of-business, regional, or functional isolation. For example, a global manufacturer might create separate spaces for EMEA operations, APAC operations, and Americas operations. Each space has its own data integrations, semantic models, and approval workflows. Changing metrics in EMEA does not affect APAC reporting, reducing cross-regional approval friction.
Datasphere assigns privileges per space through scoped roles (introduced in October 2023): an administrator combines a role template with the spaces it applies to and the users who get it. The standard templates are DW Space Administrator (operate a space and its members), DW Modeler (build data models), DW Integrator (manage connections and data integration in a space), DW Viewer (read-only access to space objects), and DW Consumer (consume exposed data in SAC and other clients without access to the Datasphere apps); DW Administrator works tenant-wide (users, roles, spaces) without access to the modeling apps, and Catalog Administrator and Catalog User cover the catalog. Custom roles combine privileges as needed. This granularity prevents privilege creep. A regional sales analyst needs DW Consumer or DW Viewer access to consume pre-built models; a data engineer building pipelines needs DW Integrator; a semantic steward needs DW Modeler in the spaces they own. By assigning the lowest role needed for each use case, organizations reduce the exposure surface when someone moves teams or leaves the company.
DACs enforce row-level security by filtering rows against a permissions entity (a table or view that maps users to allowed values). A regional sales manager assigned a DAC for their region sees only their region's sales data, even when they open the same dashboard or model as the global CEO. DAC types cover single values, operators and values (for example, ranges), and hierarchies, and since November 2025 rows can also be authorized from user attributes held in the identity provider. The filter applies to every user who reads the protected view directly or through an object built on it—SAP documents enforcement when the view is shared to another space or consumed in SAC, and Data Builder previews are filtered too. The DAC sits on the view, not on the tables beneath it, so keep sensitive raw data in a tightly governed space and expose only protected views. For sensitive governance scenarios—like HIPAA-regulated healthcare or GDPR-protected EU customer data—DACs then become a key enforcement boundary against unauthorized access.
Large organizations design space hierarchies that reflect governance maturity. A simple pattern isolates by business unit: one space for Finance, one for Supply Chain, one for Sales. A more sophisticated pattern creates Dev/QA/Production spaces for each business function, allowing controlled promotion without risk of exposing draft analysis to live users. The most complex pattern (appropriate for highly regulated industries) creates isolated spaces by sensitivity level: standard operational spaces for routine reporting, elevated-security spaces for financial data and regulatory reporting, and ultra-secure spaces for merger/acquisition data or executive dashboards containing undisclosed information. Each isolation level has explicit stewards, approval gates, and monitored access.
Row-level and column-level security transform access control from a coarse permission (you can or cannot see a dashboard) into fine-grained filtering. This is where governance becomes auditable and compliant.
Data Access Controls filter rows against a permissions entity when the protected object is consumed. The most common patterns are: hierarchy-based (a user has access to their cost center and all subordinate cost centers in the organizational hierarchy), operator-based (for example, a range on a numeric or date column), and value-based (a country or region column matched to the values maintained for the user, or to user attributes from the identity provider). A practical example: a multinational bank applies DACs so that a Branch Manager in Singapore sees only transaction data where branch_code equals SG_001, even if they query the same data model as a Compliance Officer in New York. Because the filter sits on the view that SAC and other spaces consume, data exported from SAC respects it too. Test the edge cases: SAP documents, for example, that an analytic model's value help can list members from an unprotected fact source when unbooked members are hidden.
Datasphere's data access controls are row-level only; there is no column-level DAC. Hiding sensitive columns such as employee salary, customer acquisition cost, or R&D spend from certain users is therefore a modeling task. For example, a dashboard viewer might see customer names, order amounts, and delivery dates but not the unit cost or margin percentage. Implementation patterns: expose separate views with different column sets for different audiences (each protected by DACs and shared to the right spaces), omit sensitive columns from the analytic models most users consume, and pseudonymize or aggregate sensitive attributes before they reach broad consumption layers.
Consider a global pharmaceutical distributor (a composite example) that governs a regional sales model with DACs. Sales teams in North America can access all NA sales data; European teams see all EU data. But the governance extends: within Europe, a manager in France sees only France and shared EU rollup data; a manager in Germany sees only Germany and shared EU rollup data. This is achieved through a hierarchy-based DAC on the sales organization, with each user's entry point maintained from the corporate directory. The benefit: a single shared data model and a single set of dashboards, while each regional user sees only what they are authorized to see. Auditors can trace who read which data and when if read-access audit logging is enabled for the space (retention from 7 to 10,000 days, default 30).
Beyond DACs, organizations use masking and tokenization to protect sensitive data. Masking hides values in export or logs (credit card numbers become ****, email addresses become ***@example.com). Tokenization replaces sensitive values with random tokens (customer_id 12345 becomes token_a7b2c9), so the data shape and volume remain for analytics, but the actual sensitive value is irretrievable without the token mapping. A healthcare provider might tokenize patient names and SSNs in all analytics environments (dev, qa, production), keeping only a controlled, encrypted mapping in the core EHR system. This allows data analysts to build and test models without ever seeing real patient data.
SAC security combines three layers: roles (what a user may do, assigned to users or—as SAP recommends—to teams), sharing (who can view, edit, or fully control each file or folder), and data access (which rows of a model a user may read or write). Teams make all three maintainable because they map to organizational units.
In SAC, a team is a named group of users. Roles can be assigned to teams, and SAP's guidance is to assign roles via teams rather than to individuals, and to use custom roles rather than the standard application roles. Instead of assigning a "Sales_Analyst" role to 50 users one by one, create a team called "Sales Analytics", assign the role to the team, and share the team's folders with it. When a new analyst joins the sales team, they are added to the team and inherit its roles and sharing; when they leave, removing them from the team revokes both. Role assignments can also follow groups in the corporate directory (for example, Microsoft Entra ID groups mapped to SAC roles through SAP Cloud Identity Services provisioning). This is clearer and more maintainable than managing individual role assignments.
Files and folders in SAC are shared with users or teams at predefined access levels—View (read, copy, view and add comments), Edit (adds update and, for folders, creating files and folders), and Full Control (adds delete and share)—or with a custom combination. Sharing a folder applies to its existing subfolders and files only if you select that option (or set them to inherit from the parent), so inheritance is a choice, not a default. A folder for the Sales Analytics team might contain subfolders for Regional Sales, Deal Pipeline, and Forecasting: the whole team gets View on the main folder, while Regional Sales leads get Edit on their subfolders. The access level and the user's role privileges work together—sharing can't grant an action the role doesn't allow. Managing permissions at folder level scales well: a large analytics center with hundreds of stories avoids per-object assignment.
SAC secures access per story (through sharing) and per data (through the model), not per widget. A story about regional sales might contain regional maps for all analysts, account detail tables for sales managers, and profitability charts for the CFO's direct reports—but hiding a widget only changes the presentation; a user who can open the story still has read access to the model data behind it. Restrict sensitive data where it lives: data access control on the model's dimensions (read and write permissions per member) for SAC models—it filters fact data, while dimension members can still appear in filters—and DACs in Datasphere or source authorizations for live models. Where audiences differ substantially, separate stories for separate audiences with story-level sharing remain the clearest design.
Planning models add write control on top of read control. Data access control on dimensions sets read and write permissions per member, so a regional manager can edit their region's targets but only view the company-wide consolidated target; note that read security isn't applied on private versions. Data locking blocks changes to slices of data, for example after approval. Approval workflow runs through the SAC calendar: composite tasks combine assignees and reviewers (with as many review rounds as needed), reviewers approve or reject the submitted work, and automatic data locking tasks can lock the data after submission and reopen it when a reviewer rejects. These are governance controls, not just security controls, because they enforce business process discipline.
Moving analytics content from development to production safely is a governance problem disguised as a technical problem. SAC moves content as content network packages—exported and imported directly between tenants, or routed through SAP Cloud Transport Management (cTMS) for controlled, cross-landscape transports. Datasphere integrates with cTMS too (since release 2024.14) and offers a command-line interface for scripted deployment.
SAC's content network packages stories, models, planning objects, and their dependencies for transport between tenants. A typical flow: content is developed in a Dev tenant, exported as a package, imported to QA, tested, then imported to Production. Each step is manual unless you route it through cTMS, and approval happens outside the tool. Direct export and import works well for smaller organizations or simple linear flows; it scales poorly with multiple development streams, and missing dependencies or overwritten objects need careful import options and testing.
SAP Cloud Transport Management (cTMS) adds governance to the same packages: you upload a content network package to a transport node, and it moves along defined routes through import queues into QA and Production tenants, including across global accounts and on schedules. Import queues and transport logs show what moved where and when, which supports change-approval evidence. cTMS moves content forward; it doesn't version or roll back SAC content for you—plan reversals separately (see below). The same service also transports Cloud Integration content and SAP BTP application artifacts, so one change-control process can cover several layers of the analytics landscape.
Mature organizations treat analytics content like software: versioned, reviewed, and traceable. Since the 2026 QRC1 update, SAC keeps file versions for optimized stories: designers save versions (up to ten), see who saved each one and when, open them read-only, and restore one as the current version—referenced models and other objects are not versioned with the story. Datasphere keeps object versions for views, analytic models, DACs, and local tables (metadata only—restoring a version overwrites the current definition), and its command-line interface lets teams keep object definitions in Git and deploy from a pipeline. Parallel development on one story still leads to overwrites, so assign one owner per story, work in copies, and promote through packages. The alternative (a single shared story with no change tracking) is a governance nightmare: multiple people editing the same story, unclear who changed what, and no easy way to revert a problematic edit without losing other improvements.
Governance requires not only a way to move content forward, but a documented, tested way to revert changes. A rollback strategy specifies: if a transported story or planning model causes data integrity issues or user confusion, how quickly can it be reverted, and from what? Options include SAC story file versions (optimized stories), Datasphere object versions, and the previous content network package kept for re-import. How long must data and audit logs be retained to support forensic analysis? For critical content (financial reporting dashboards, planning input templates), keep the previous version restorable until the new one is confirmed in production. For less critical content, immediate replacement is acceptable. Testing rollback procedures during QA transport (not discovering in a production incident that you cannot revert easily) is part of mature governance.
Analytics governance is auditable governance. Compliance regulations (SOX, GDPR, CCPA, HIPAA, GxP, PCI-DSS) all require evidence that access was controlled, changes were approved, and data handling was transparent.
Space administrators can enable audit logging per space for read operations, change operations, or both; the database then records successful SELECT statements (read) and INSERT, UPDATE, and DELETE statements (change) against the space's data, with who did what and when. Retention is set per space from 7 to 10,000 days (default 30), the logs consume tenant storage (the System Monitor shows their share), and you can export them before they are deleted. Administrators analyze them by assigning the audit views to a dedicated space and modeling on top. Separately, object versions and the impact and lineage analysis show how models changed. For financial reporting scenarios, an audit log showing that the CFO's office read the revenue model on March 15 at 2:15 PM is evidence for Sarbanes–Oxley controls. For GDPR scenarios, change logs showing that the rows covered by an erasure request were deleted on March 16 document the erasure.
SAC's activities log records activities on business objects—including permission and access-control changes, model changes, story views, logins, and user and role changes—and administrators can filter it, download it as CSV, and delete older entries to keep its size in check. For planning models, the data audit records who changed which public-version values, with old and new values, when it is enabled for the model. The System Overview adds usage statistics such as story usage. A compliance audit for SAC typically reviews story access in the activities log to ensure that sensitive financial dashboards were viewed only by authorized users. If an audit finds that a non-finance user accessed the revenue model, that triggers an investigation: was it accidental access, did the user then view sensitive data, who granted them permission and why.
Sarbanes–Oxley (SOX) internal-control requirements for financial reporting translate in analytics into controlling who can access and modify financial data, documenting approval for key changes, and keeping an audit trail. SAP Datasphere and SAC governance supports those controls by: (1) restricting changes to financial data models to a small group of named owners (modeler and space administrator roles scoped to the finance spaces, plus semantic review gates), (2) requiring sign-off on quarterly and annual reporting dashboards before release (release approval gates), and (3) keeping evidence of access and change (Datasphere audit logs where enabled, the SAC activities log, and transport records). A financial services firm can support an external SOX audit by producing Datasphere audit logs showing who read the GL data, the SAC activities log showing which finance team members opened the reporting dashboards, and a change log showing that all KPI definitions were reviewed and approved before release. The tools provide evidence; the control design and its testing remain the company's responsibility.
The General Data Protection Regulation (EU) gives data subjects rights that analytics governance must support, including access ("show me what data you have about me"), rectification ("fix this error"), and erasure ("delete my data") where its conditions apply. When an erasure request is valid, deleting the record in the source system is not enough: replicated copies in analytics systems must be purged too. Lineage in the Datasphere catalog (or an enterprise catalog such as Collibra) shows where customer data flows from source to Datasphere to SAC, so you can find every copy. An audit trail showing "customer record 12345 deleted from source on March 15, Datasphere rows deleted on March 16, SAC import model reloaded on March 17" is evidence of timely handling.
The California Consumer Privacy Act (CCPA), as amended by the CPRA, gives consumers rights to know, delete, and correct their personal information, to opt out of its sale or sharing, and to limit the use of sensitive personal information—an opt-out model rather than GDPR-style lawful bases. Healthcare analytics under HIPAA must safeguard PHI under the Security Rule (encryption is an addressable safeguard, decided through risk analysis), and data meant to leave the PHI regime must be de-identified by Safe Harbor (removing 18 identifiers) or Expert Determination. Life-sciences companies under GxP rules such as FDA 21 CFR Part 11 need secure, computer-generated, time-stamped audit trails for operator actions that create, modify, or delete electronic records. PCI DSS forbids keeping sensitive authentication data after authorization and requires stored card numbers (PAN) to be unreadable wherever they are stored—the simplest analytics answer is to keep card data out entirely. These regulations succeed in SAP when governance specifies not only who can access data, but how it must be handled (pseudonymized, de-identified, excluded, never logged). Governance documentation should map each regulation to specific controls: for example, "HIPAA identifiers are removed or pseudonymized in the Datasphere views shared for broad consumption, and only a restricted space holds identified data."
Data privacy in analytics is a multi-step process: identify where personally identifiable information (PII) lives, mask or anonymize it to reduce risk, implement consent management, and honor the right to erasure when requested.
The first step of privacy governance is knowing where personal data exists. Personal data includes names, email addresses, phone numbers, national ID numbers, IP addresses, cookie IDs, and (under GDPR) anything that can identify an individual directly or indirectly. Organizations typically use data classification and catalog tools to scan source systems and Datasphere and tag columns as personal or sensitive; SAP Business Data Cloud's 2026 releases added automatic data privacy and protection (DPP) tagging. Once tagged, metadata tracks which systems contain personal data, who has access, where it is replicated, and whether it is masked. This inventory is critical for privacy impact assessments and data subject requests (if a customer asks "do you have my data?", the inventory tells you which systems and Datasphere spaces to check).
Tokenization replaces sensitive values with random tokens, preserving data shape for analytics but removing actual sensitive content. A customer name "John Smith" becomes "token_a7f2b1c9", and only a secure vault holds the mapping. Hashing applies a one-way function so that "john.smith@example.com" becomes a fixed-length value (a 64-character hexadecimal string with SHA-256). It can't be reversed directly, but common values such as email addresses can be found again by hashing guesses, so use a keyed or salted hash—and remember that hashed or tokenized identifiers are still personal data (pseudonymized) under GDPR. Generalization removes precision: "birthdate 1985-03-15" becomes "birthdate 1985" (year only), or "zip code 94025" becomes "zip code 94***" (first three digits only). Generalization preserves data utility for analytics while reducing the risk of re-identification. Most organizations use a mix: names and emails are tokenized, birthdates are generalized to year, and customer IDs are hashed.
Anonymization differs from masking: anonymization ensures that individuals cannot be re-identified even if an attacker combines the analytics data with external data. K-anonymity means that every row in a dataset matches at least k other rows on quasi-identifiers (combinations of non-sensitive attributes that could re-identify). For example, if a dataset contains age, zip code, and salary, and you can uniquely identify someone by combining those three attributes, it violates k-anonymity. To achieve k-anonymity=5, you generalize or suppress attributes so that at least 5 rows match every combination. Differential privacy is a mathematical guarantee that the presence or absence of a particular individual's data does not significantly change aggregate statistics. A health insurance analyst running a report on average claim costs should get nearly the same answer whether a particular person's data is included or excluded. Differential privacy adds small random noise to aggregate results to ensure this. Both techniques reduce privacy risk but add complexity and may reduce analytical utility.
GDPR requires a lawful basis for each processing purpose—consent is one of six, alongside contract, legal obligation, vital interests, public task, and legitimate interests—while the CCPA lets consumers opt out of the sale or sharing of their personal information. Where analytics relies on consent, consent management systems (often integrated with CRM or data platforms) track who has consented and who has withdrawn; where it relies on legitimate interests, the balancing assessment must be documented. When a valid erasure request arrives, the organization must purge the person's data from all systems. In SAP, this triggers a workflow: (1) identify which Datasphere tables contain the person's data (via the personal-data inventory), (2) run delete jobs to remove matching rows, (3) cascade the deletion through dependent systems (SAC import models, export archives, exported reports), (4) log the deletion for audit. Right-to-erasure workflows are complex at scale (erasing a customer from a 50-table Datasphere warehouse means coordinating deletes across tables with referential integrity constraints). Organizations typically batch erasure requests (daily or weekly), test the delete job in QA, then run it in Production with automated validation that the records were actually deleted.
GDPR requires a Data Protection Officer (DPO) for public authorities and for organizations whose core activities involve large-scale, regular and systematic monitoring of individuals or large-scale processing of special categories of data; many other organizations appoint one voluntarily. The DPO coordinates with analytics governance: ensuring that data classification is accurate, erasure requests are honored, retention policies are enforced, and privacy impact assessments are completed before deploying new analytics systems. From a governance structure perspective, the DPO and the analytics governance owner should have regular communication. When a new Datasphere space is created, the DPO should review: what personal data will it contain, who has access, how long is it retained, is it ever transferred outside the EEA (which needs a transfer mechanism such as an adequacy decision or standard contractual clauses), and what are the erasure procedures. Good governance integrates privacy controls into the release approval gate, not treating them as an afterthought.
SAP's acquisition of Reltio — announced in March 2026 and completed in May 2026 — brings AI-ready master data management into the analytics governance conversation; SAP Reltio in SAP Business Data Cloud is now generally available, with unified data-product capabilities planned for GA in Q1 2027. Master data governance ensures that core entities (customers, products, suppliers, employees) have a single, authoritative definition shared across all analytics, ERP, and line-of-business systems.
Master data (also called reference data or dimension data) includes customers, products, cost centers, and any other entities referenced across the enterprise. When sales systems, finance systems, and analytics systems do not agree on a customer definition, analytics becomes a house of cards: reports disagree on customer counts, revenue attribution becomes murky, and reconciliation requires hours of manual work. A master data platform such as SAP Reltio or SAP Master Data Governance lets business stewards (not just data engineers) define, govern, and publish master data. A Product Master Steward can define: "A valid product must have an SKU, a product line, and a cost center. Products in the Discontinued status should not appear in revenue reports. Product name changes trigger a review by the Finance team before publishing." The platform enforces these rules, keeps the history of changes, and publishes curated master data to Datasphere and downstream systems. Datasphere models can then treat the product dimension as authoritative and consistent.
SAP announced Data Product Studio at TechEd 2025 with general availability planned for the first half of 2026; as of November 2026, SAP has not confirmed GA, so plan with what is available. Business Data Cloud already treats data products as governed assets: custom data products are listed and delisted through the Data Sharing Cockpit under a named provider, and data product governance added in September 2026 covers terms and conditions, steward approval, and access agreements. Inside Datasphere, release states give shared views a stable contract: a Released view stays backward compatible (only additions), a Deprecated view needs a released successor, and a view can be decommissioned only after at least a year as deprecated and two years after release. A Finance team can publish a "Monthly Ledger" view or data product with metadata such as owner (CFO's office), sensitivity (internal use only), freshness (daily), and change process (no structural changes without notice). Adding a field fits the released contract; a breaking change means a released successor and a deprecation period, so downstream teams can move on their own schedule. This makes governance explicit: "This data product changed on March 15—is my dashboard affected?"
Model stacking—building analytic models on top of other analytic models, possible in Datasphere since release 2025.08 (initially within one space and for single-fact models), and more broadly cascading views where downstream models depend on upstream ones—is powerful but risky without governance. If a Finance team changes a KPI definition in an upstream model, all downstream business unit models that consume that KPI are affected. Without governance, that change can go unnoticed and silently corrupt downstream analytics. Governance for model stacking means: (1) Impact analysis before changes: Datasphere's impact and lineage analysis shows which downstream objects are affected. (2) Change review gates: downstream model owners sign off on upstream changes that affect them, or the upstream change is rejected or isolated. (3) Notification and deprecation: consumers can't stay on an older version of the same object, so breaking changes go to a released successor with a deprecation period instead of silently replacing the original. The tooling shows the dependencies; the governance process must make teams consult it before publishing changes.
Traditional audit logs are point-in-time records: "User X accessed data Y at time Z." Event-driven audit goes further by treating every governance-relevant action (model deployment, DAC change, data product release, definition update) as an event that triggers consequences. In practice these events come from your own deployment pipeline rather than from the platform: a CI/CD job that deploys Datasphere objects through the command-line interface can post a "model published" event that notifies dependent model owners, runs validation checks on the new model, and records the change. When a data classification changes from "Sensitive" to "Public," a "classification changed" event can trigger an access review (if you made it public, have you checked who can now see it?). This creates a governance feedback loop where changes are not fire-and-forget but automatically connected to consequences. Combined with the audit logs, it also makes retroactive compliance queries answerable: "Show me all semantic changes that affected customer data in the last quarter" becomes a query over recorded events, not hand-excavation of logs.
Authentication (verifying who a user is) and authorization (determining what they can do) are the foundation of all governance. Modern SAP analytics relies on identity services that integrate with corporate identity providers.
SAP Cloud Identity Services combines Identity Authentication (IAS: login, MFA, password policies, and proxying to corporate identity providers) and Identity Provisioning (IPS: synchronizing users and groups between source and target systems). IPS reads users and groups from sources such as Microsoft Entra ID and provisions them into targets such as SAP Analytics Cloud, where groups can be mapped to roles. IAS sits at the boundary: when a user authenticates, it validates their credentials (or delegates to the corporate IdP), optionally enforces MFA, and issues the assertions that SAC, Datasphere, and related services trust. IPS keeps user lists synchronized: when a user joins in the corporate directory, provisioning creates them in the target systems; when they leave, provisioning removes them. Together, IAS and IPS keep user identity centrally managed through the corporate directory, not maintained by hand in each SAP system. This is critical for governance: when an employee leaves the company, they are removed from the directory once, and provisioning propagates that change, rather than requiring manual deprovisioning in ten different systems.
SAML (Security Assertion Markup Language) is the protocol that lets SAP systems trust identity assertions from corporate identity providers such as Microsoft Entra ID, Okta, or Ping Identity—directly or through IAS as a proxy. When you configure SAML single sign-on for SAC or Datasphere, users log in with their corporate credentials and never hold a separate SAP password. For governance, SAML federation means that password policies, MFA requirements, and user status (active or inactive) are enforced centrally through the corporate IdP, not replicated across systems. If corporate policy changes to require phishing-resistant MFA, that change applies at the next login to Datasphere, SAC, and every other federated system without per-system configuration.
Principal propagation passes the end user's identity from the front end to the system that holds the data, so that system can apply its own authorizations. In SAP analytics it works per connection type. SAC live connections to S/4HANA, BW, and SAP HANA run queries as the signed-in user (single sign-on, with the Cloud Connector propagating the principal for tunnel connections), so source authorizations apply directly. SAC's live connection to Datasphere passes the user too, and Datasphere applies its DACs. Datasphere's own connections to sources such as S/4HANA on-premise, however, use a technical user—SAP states that this is the only option—so source authorizations do not follow the end user into Datasphere, and row-level restrictions must be rebuilt there with DACs. That is the design decision to make explicit: either query live from SAC where source security must apply, or replicate into Datasphere and re-implement the restrictions, keeping both role models consistent (the same user should not be a sales manager in S/4HANA but an unrestricted viewer in Datasphere).
MFA (requiring a password plus a second factor like a hardware token or authenticator app) should be mandated for privileged roles. Datasphere administrators and space administrators can change users, role assignments, and DACs, potentially exposing sensitive data. MFA ensures that compromising a password alone is insufficient to breach those accounts. Many organizations extend MFA requirements to anyone with Editor access to critical stories in SAC (financial reporting, board-level dashboards) or access to Datasphere modeling (DW Modeler, DW Integrator). MFA adds friction to login, but the security benefit is significant for high-risk accounts. Identity providers can also require MFA based on risk signals: if a user logs in from an unfamiliar location or device, or during unusual hours, MFA might be required even for normal users.
Data quality is a governance responsibility because poor quality data causes decisions based on inaccurate information. Governance for data quality includes defining what "good" looks like, monitoring for violations, and correcting issues.
Datasphere has no general data-quality rule engine comparable to SAP Information Steward—SAP has confirmed this in a knowledge base article. What it offers are data validations (key and hierarchy checks on views, later extended to fact data) plus whatever you model yourself: validation views that count violations of expectations such as "Customer_ID is never null," "Order_Amount is positive and less than $1,000,000," "Order_Date is never in the future," or "Invoice_Paid_Date is not null if Invoice_Status is Paid." Run them as part of the load (in a task chain after the data flows) and expose the results in a quality dashboard that shows violation counts, the records involved, and when each violation first appeared. For broader rule management and profiling, partner tools step in—Collibra, for example, offers data quality and observability with pushdown to SAP HANA, SAP HANA Cloud, and Datasphere. Profiling analyzes data to discover patterns: the min, max, and distribution of values, null counts, the most common values, and unexpected outliers. It often reveals issues that rules alone miss: a credit limit column that suddenly has values 10x higher than historical ranges, or a customer segment column with a new value the business never approved.
Leading organizations treat data quality as a KPI: completeness (percentage of non-null values), accuracy (percentage of records passing validation rules), timeliness (how recent is the data, freshness), and consistency (do duplicate records have matching values across systems). A dashboard might show: "Completeness: 99.2% (target 99.5%); Accuracy: 97.8% (target 98%); Timeliness: average lag 4 hours (target <2 hours)." These KPIs are owned by the data steward for each domain, and poor quality trends trigger investigation and remediation. If completeness suddenly drops from 99.5% to 92%, the steward investigates: did the source system fail, did an ETL job break, did a database corruption occur. By tracking KPIs, governance can detect quality issues before they propagate into business intelligence and cause decision errors.
When quality rules detect violations, the governance response includes: (1) notification to the data owner or steward, (2) investigation and root cause analysis (did the data come in wrong, or did a transformation break), (3) remediation (correcting the data or fixing the source/ETL), and (4) re-validation (confirming the data now passes the rule). Mature organizations track remediation in a workflow system: a quality violation creates a ticket, is assigned to the data steward, and must be resolved (and closed) within an SLA (e.g., within 2 business days for standard data, within 4 hours for critical financial data). Audit logs track who made corrections and when. If an analytics dashboard was published using data that later failed quality rules, the governance process includes deciding: do we recall/republish the dashboard, do we publish a correction, or do we accept the data quality issue and note it in the dashboard footnotes. This decision discipline separates professional analytics governance from ad-hoc approaches.
Enterprise data quality governance often involves third-party tools such as Collibra or Informatica (part of Salesforce since November 2025). These tools provide governance as a separate layer: catalogs, business glossaries, quality rules, and lineage that sit above individual systems. When an organization combines Collibra with Datasphere and SAC, a typical split is: Collibra owns the enterprise glossary and quality rules and runs its checks against the data (pushed down to the database where supported); Datasphere holds the semantic layer; SAC consumes the data and creates stories. Make the result visible where people consume the data—for example, by loading quality scores into Datasphere and showing a data-quality status on the dashboards—so analysts know when not to rely on a figure. Pipeline tools follow the same principle: if a pipeline fails its quality gates, it should not publish its output to Datasphere, preventing bad data from reaching analytics.
Master data (the dimensions shared across multiple business processes) is the semantic backbone of analytics. Inconsistent master data is the root cause of many analytics failures. Master Data Governance (MDG) ensures single versions of truth for customers, materials, vendors, cost centers, and other key dimensions.
Master Data Governance systems (SAP Master Data Governance runs on S/4HANA and is now a core component of SAP Business Data Cloud; SAP Reltio adds multidomain MDM) maintain authoritative copies of shared dimensions. Instead of having Customer data scattered across CRM, ERP, and data warehouse (each with slightly different customer codes or names), MDG acts as the single repository. All systems—CRM, ERP, Supply Chain, Analytics—reference the same Customer master from MDG, ensuring consistency. For analytics, this means dimension tables in Datasphere are fed from MDG, not from the source systems directly. A regional sales manager querying "customer revenue by customer segment" will get the same customer segment classification whether they query through SAC (pulling from Datasphere dimensions from MDG) or through a CRM dashboard (pulling from CRM dimensions also from MDG). This consistency removes a major source of confusion and disputed metrics.
When an organization has multiple ERPs (post-acquisition or multi-region), MDG reconciliation is complex. The classic scenario: Company A acquired Company B, both have their own Customer master in their ERP. MDG consolidates: duplicate customers are identified (customer "Acme Inc" in Company A and "Acme Inc." in Company B are the same), one master record is created, and both ERPs are configured to reference the unified customer. This reconciliation process is governed: a reconciliation team (business users, not just IT) reviews identified duplicates, approves matches, and decides which attributes (name, address, credit limit) take precedence when merging. Analytics governance includes monitoring: once the consolidated customer master is in place, reports must be built to ensure all transactions from both ERPs are correctly rolling up to the unified customer dimension.
In a typical flow, MDG master data is replicated to Datasphere either directly from the MDG system (for example, with replication flows) or from S/4HANA after the master data has been distributed there. Datasphere semantic layers then reference the MDG-derived dimensions. Change governance is critical: when a customer's credit limit is updated in MDG, when does that change appear in Datasphere? If it is immediate, all analytics reflecting the new credit limit is consistent but can be disorienting (historical data suddenly refers to different credit limits). If there is a lag, analytics might be inconsistent (one dashboard shows old limits, another shows new). The governance decision: define a synchronization schedule (nightly, hourly, near-real-time) and publish that in the data catalog so analysts know the freshness of dimension data. For critical dimensions (customer, product), near-real-time synchronization is typical; for slowly changing dimensions like cost-center hierarchies, nightly is sufficient.
When master data is fragmented or inconsistent, analytics fails in subtle ways. A supply chain manager asks "how much did we sell to Acme Inc last year?" and gets three different answers depending on which dashboard they use: one shows $5.2M (using Company A customer master), one shows $8.1M (using Company B customer master), one shows $13.3M (using consolidated master). Rather than trusting the analytics, the business resorts to manual reconciliation in Excel, defeating the purpose of the analytics platform. Good master data governance eliminates this: there is one Acme Inc, one answer ($13.3M), and everyone trusts it. The investment in MDG and Datasphere semantic models pays off in reduced time spent reconciling metrics and increased trust in analytics-driven decisions.
A catalog with complete lineage and impact analysis capabilities allows governance to understand the full journey of data and to predict the consequences of changes before they cause issues.
Data lineage tracks the path from source system → transformations → Datasphere semantic layer → SAC stories/dashboards → end user actions (exports, shares, decisions). Full lineage allows answering critical questions: "if the ERP customer master is updated, which Datasphere models are affected, which SAC stories depend on those models, and which business users will see the change?" Lineage depth depends on the tool: the Datasphere catalog's impact and lineage diagram covers sources, transformations, associations, data access controls, and affected objects, and column-level lineage—where your catalog provides it—tracks lineage at finer granularity: "the Revenue column in the Sales story comes from the order_amount column in table X, which is fed from the S/4HANA billing module." This precision is invaluable for impact analysis and auditing: if an auditor asks "is the revenue figure on the executive dashboard connected to the source ERP revenue?", complete column-level lineage proves the connection unambiguously.
When a data steward proposes changing a KPI definition (e.g., "let's now exclude promotional orders from revenue calculations"), impact analysis answers: which stories/dashboards consume this KPI, how many users access those stories monthly, would the change cause these stories to show different numbers, and which business processes depend on the old definition. Armed with this information, the steward can plan the change: notify affected dashboards, prepare alternative versions showing both old and new definitions during transition, and schedule the change to avoid a critical financial close period. Without impact analysis, changes are blindly made and cause dashboard outages and user confusion.
Technical lineage (source table → column → transformation → target column) is necessary but insufficient for business stakeholders. Semantic lineage connects business terms: the business glossary term "Customer Lifetime Value" is defined as "total revenue from a customer across all transactions"; that definition is implemented in Datasphere as a specific formula in the customer_ltv column; that column feeds the executive dashboard's CLV card; the executive dashboard supports quarterly business reviews. Semantic lineage allows a business user (without SQL knowledge) to understand what a metric truly means, where it comes from, and what consequences a change would have. SAP provides a business glossary and KPI definitions in the Datasphere catalog (with AI help for generating descriptions and terms); enterprise catalogs such as Collibra can manage larger semantic ontologies.
Organizations without lineage or impact analysis capabilities make changes blindly. Classic scenario: a data engineer optimizes a query in Datasphere without realizing it feeds the CFO's weekly cash flow dashboard. The optimization changes a rounding rule, causing the cash flow forecast to be $1.2M different than before. The CFO notices the discrepancy mid-week, demands investigation, and the change is rolled back. Days of effort and lost trust in the analytics platform. With impact analysis in place, the engineer would have known before making the change that their modification affects a critical financial dashboard, and either coordinated with the CFO or ensured the change was backward compatible. Impact analysis is a governance control that prevents avoidable surprises.
Governance is not passive observation; it is active operational discipline. Monitoring provides visibility, and operational teams respond to issues before they degrade trust.
Datasphere's System Monitor shows the state of the tenant: storage and memory use by space (including the share taken by audit logs), task runs and failures, and statement logs with the most expensive statements. Key governance metrics: data freshness (how recent is the most recent load), task success rates (the share of scheduled flows and task chains that completed without error), change activity (who changed what, when), and query performance (how long queries take, which are slow). A well-managed Datasphere is monitored proactively: if a data flow begins failing repeatedly, the team investigates and fixes it before users start complaining about stale data. If a query suddenly becomes slow, the performance team tunes it. If a user suspiciously begins accessing data they previously did not have access to, the governance team investigates whether permissions were incorrectly granted (read-access audit logs make that visible).
With expensive statement tracing enabled (System → Configuration → Monitoring, with thresholds you set), Datasphere records queries that consume significant resources. Some queries are legitimately expensive (aggregating years of transaction data), but others are wasteful (poorly written SQL, unnecessary data scans, cartesian joins). The governance process: expensive queries are logged; the query author is contacted; the query is reviewed for optimization opportunities. A single query optimized from 5 minutes to 30 seconds saves significant compute (and improves user experience). Organizations with high analytics usage (thousands of queries daily) often assign a performance engineer to continuously monitor and optimize expensive statements. The trace data is available through monitoring views in a dedicated monitoring space, so you can build your own dashboards or feed external tools.
Datasphere consumes capacity units (CUs) for storage and compute—in SAP Business Data Cloud, from a shared CU pool. A space that is not managed can grow uncontrollably: duplicate tables, unused historical data, redundant models. Governance monitors space size and capacity consumption: which spaces are growing, which tables are rarely accessed, which models are unmaintained. Periodically (quarterly), a governance audit might find: "Space A has 50 tables, but 30 are not accessed by any SAC story. Cost to store these: $5K/year. Recommendation: delete or archive." By managing space usage, organizations reduce cloud costs and improve platform cleanliness. Additionally, smaller spaces with fewer irrelevant tables are easier to maintain and understand.
SAC's System Overview (formerly the Administration Cockpit) provides usage statistics—how many users are active over time, which stories are most and least used, and how much time users spend interacting with stories—alongside performance, data action, and data management job statistics. Adoption metrics guide governance decisions: a low-usage story might be consolidated with higher-usage alternatives, or if it is critical but unpopular, additional training or promotion might be needed. High-usage stories are monitored for performance and accuracy (they are trusted by many users, so correctness is critical). Usage analytics also support business cases for analytics investments: if a planning story is used by 500 planners monthly, it justifies investment in optimization and support.
Governance establishes alerting policies: data flow failures are escalated to the data engineering lead within 1 hour; SAC performance degradation is escalated to platform support within 30 minutes; a user accessing more data than their role allows is escalated to security within 15 minutes. Alerts are automated through SAP Cloud ALM where it covers the service, SAP Alert Notification, or third-party monitoring platforms. The discipline of clear escalation paths ensures that issues do not languish. Governance teams review escalation and alert trends monthly: if data flow failures are increasing, investigate whether the integration systems are becoming unstable. If query performance alerts are frequent, consider infrastructure scaling or query optimization initiatives.
SAP's EU AI Cloud (unveiled on November 27, 2025) addresses sovereignty concerns for organizations in regulated markets: EU data residency and full-sovereignty options—SAP Sovereign Cloud on SAP Cloud Infrastructure in Europe, on-site deployments, selected hyperscalers, and Delos Cloud—with AI models from Cohere, Mistral AI, OpenAI, and others running in European data centers. Sovereignty is not compliance, though: obligations under the EU AI Act and GDPR stay with you. This opens a governance conversation beyond traditional security.
GDPR does not mandate data localization, but it restricts transfers outside the EEA to cases with a valid mechanism (an adequacy decision or appropriate safeguards such as standard contractual clauses); sector rules, public-sector contracts, and some other jurisdictions go further. Healthcare data, financial records, and government contractor data often carry such residency requirements. AI adds new paths for data to leave a region—prompts, grounding data, and model calls—so residency rules have to cover them too. With EU AI Cloud options, AI inference can stay in European data centers: a pharmaceutical company using Joule to analyze clinical trial data can keep that processing in Europe if it chooses the deployment accordingly. The governance requirement: track which data is subject to residency constraints, ensure that AI processing of that data stays in the approved region, and audit to prove it during regulatory inspections. This is stricter than traditional cloud governance, which might allow data replication or processing outside the region.
The EU AI Act sets strict obligations for high-risk AI systems—such as Annex III uses in recruitment and employment or creditworthiness assessment—which, after the Digital Omnibus on AI (Regulation (EU) 2026/1744), apply from December 2, 2027 (August 2, 2028 for AI embedded in Annex I products). They cover risk management, data governance, documentation, logging, and human oversight; deployers must assign competent human oversight and keep automatically generated logs for at least six months. Governance must own: (1) Training data quality: is the training data representative, or biased toward certain groups? (2) Model explainability: can you explain why the model made a recommendation? (3) Fairness assessment: does the model produce fair outcomes across demographic groups, or does it systematically disadvantage certain groups? (4) Human override: before publishing an AI-assisted recommendation, is there a human who reviews and can reject it? (5) Audit trail: can you reconstruct which data and which model version produced a recommendation? These requirements often mean that analytics teams must work with legal, ethics, and data science teams—not just traditional business analysts.
As organizations deploy more AI (Joule recommendations, intelligent content, generative AI, agents), treating models like black boxes becomes untenable. Model governance tracks: which models are in production, what version, trained on which data, with what performance metrics, approved by whom, and when does it need retraining? If a model degrades over time (a recommendation engine trained on 2024 data becomes stale in 2026), governance specifies: (1) monitoring for model decay, (2) triggers for retraining, (3) testing and validation before deploying new versions. Model versioning also enables rollback: if a new model version performs worse than the prior version, you can revert to the prior model while investigating the issue. On the SAP side, SAP AI Agent Hub (GA since May 2026) provides a vendor-agnostic registry of agents, MCP servers, and LLMs with a define–verify–enforce–monitor–optimize lifecycle, and its AI Governance Assistant (in preview since October 2026) proposes EU AI Act risk classes as drafts for legal review; governance teams should use such registries to manage the AI surface at scale.
Datasphere already provides the building blocks for structured change management. Object versioning (since 2025) keeps the history of views, analytic models, DACs, and local tables—metadata only, so restoring a version overwrites the current definition. Release states turn shared views into contracts: Released views stay backward compatible, Deprecated views need a released successor, and decommissioning requires at least a year as deprecated and two years after release. Combined with impact and lineage analysis and cTMS transports, this prevents the silent breaking changes that often plague analytics (a KPI definition changes unexpectedly, breaking downstream dashboards). What it doesn't provide is consumer-side version pinning: teams consuming a model always see its current definition, so breaking changes need a successor object and a deprecation period. Versions also support audit trails: "What changed in the customer semantic model last quarter?" becomes answerable from metadata, not by comparing spreadsheets.
Cloud analytics platforms charge by usage (capacity units, queries executed, concurrent users). Cost governance ensures that spend is visible, justified, and optimized.
In SAP Business Data Cloud, Datasphere and the other capacity services draw down capacity units, while SAC usage is metered per user within the same commercial frame. A governance dashboard tracks: "This month: 500 CUs consumed (budget: 600), cost $50K (budget: $60K). Consumption trend: +15% month-over-month. Forecast: 650 CUs next month (+8% over budget)." Mature organizations assign CUs to spaces and business units and charge them back: Sales Analytics space consumed 200 CUs; Finance Analytics consumed 300 CUs. This visibility encourages cost discipline. Sales teams are more thoughtful about what analyses they request if they see the cost reflected in their budget. Some organizations implement charge-back policies where space teams must justify their usage or find ways to reduce consumption if they exceed budget.
Consumption data comes from several places: SAP for Me's Public Cloud Consumption card shows usage across SAP public cloud subscriptions (the billed BDC metrics include capacity units for BDC and for BDC Connect), BDC's capacity-unit monitoring added historical views by space and object storage in 2026, Datasphere's System Monitor shows storage and memory per space, and SAC's System Overview shows usage. Allocation by department, team, or story is your own showback model built on those numbers. It lets you answer: "Are 80% of our analytics costs driven by Finance (justified—they run financial close monthly) or spread broadly (suggesting we should consolidate or optimize)?" Consumption analysis also helps forecast: if Sales space consumption grows 20% annually and you plan three years ahead, you can budget for expected growth—SAP's Business Data Cloud Capacity Unit Estimator helps size new workloads—and negotiate capacity in advance.
Cost optimization tactics include: (1) periodic cleanup (delete unused tables, models, and stories), (2) right-sizing (choose appropriate storage tier—hot vs. warm vs. cold data—based on access patterns), (3) query tuning (rewrite expensive queries, add caching for frequently executed queries), (4) scheduling intelligence (run heavy workloads during off-peak hours to take advantage of lower pricing, if available). Systematic optimization usually pays for itself quickly. The governance role: establish an optimization program, assign owners (typically data engineering and platform architects), and track progress.
Even if direct chargeback is not implemented, showback reporting (showing teams what their analytics infrastructure costs) increases awareness. A business unit might not realize they are responsible for 25% of Datasphere spend; seeing that in a monthly report prompts them to either justify the investment or find ways to reduce costs. Showback reports are typically delivered monthly to department heads and senior leaders, tied to business metrics: "Marketing Analytics consumed $8K in cloud costs and influenced 40 campaigns reaching $50M in customer lifetime value—strong ROI."
Large organizations often operate multiple analytics tenants (separate SAC/Datasphere instances) for different business units, regions, or legal entities. Governance must balance local autonomy with enterprise consistency.
Centralized governance: one global team owns analytics policy, security standards, and release discipline. All business units follow the same processes, roles, and approval gates. Pro: consistency, single version of truth, efficient shared services. Con: slower to respond to local needs, may impose overhead inappropriate for smaller units. Federated governance: each business unit owns its analytics, follows local policies suited to their business. Central team provides frameworks and standards but does not micromanage. Pro: faster innovation, local ownership, flexibility. Con: inconsistency (different business units use different KPI definitions), duplication (each unit maintains similar data and models), harder to get enterprise-wide metrics. Most large organizations use hybrid: central governance for foundational standards (security, data quality, lineage), local governance for content approval and operational decisions.
In multi-tenant environments, shared services provide economies of scale. A central data engineering team builds and maintains shared data integrations (e.g., bringing S/4HANA, Salesforce, and Workday data into a shared Datasphere). Business units consume the shared data via semantic models, building their own stories and planning models on top. This pattern avoids duplication (each business unit would otherwise maintain its own copy of customer and product data) and ensures consistency (all units see the same customer definitions). Governance controls the shared data: the central team defines quality rules, permissions, and retention policies. Business units have autonomy to create their own layers (semantic models, stories) on top.
Multinational organizations face additional complexity: data residency requirements (for example, contracts or sector rules that keep some EU data in Europe), legal entity separation (financial data for subsidiary A must not be accessible to subsidiary B unless explicitly authorized), and language/cultural differences. Governance strategies: (1) Separate Datasphere spaces per region/legal entity, with clear data residency boundaries. (2) Federated semantic modeling: each region maintains its own semantic layer, but models reference standardized dimension definitions from a central master-data platform. (3) Controlled federation: a central data lake brings together data from all regions (respecting residency), but sensitive data is never exposed; instead, aggregated summaries or encrypted data is shared. (4) Compliance tracking: audit logs track which users accessed data in which regions and for what purpose, supporting regulatory audits in multi-jurisdiction scenarios.
A multi-tenant governance dashboard provides executives and central governance teams with enterprise-wide visibility: total analytics users, active spaces, data freshness across regions, adoption trends, cost consumption by business unit, compliance incidents and their resolution. This dashboard is typically reviewed monthly by a central governance council, informing decisions about analytics investment, resource allocation, and policy changes.
Despite strong governance, incidents happen: unauthorized data access, metric errors, integration failures. How an organization responds determines whether trust is recovered or permanently damaged.
A security incident in analytics might be: unauthorized access (a user viewed data they should not), data leakage (sensitive data was exported or shared, a dashboard containing confidential information was published to wrong audience), account compromise (a user's credentials were stolen and used to access data). The incident response playbook specifies: (1) Detection: automated alerts for suspicious access patterns or manual report, (2) containment: if data was leaked, revoke access and retract shared links, and involve the data protection officer at once—under GDPR, a personal data breach must be reported to the supervisory authority within 72 hours of becoming aware of it unless it is unlikely to pose a risk, and affected people must be told when the risk is high, (3) investigation: audit logs show what data was accessed, by whom, when, what was exported, (4) remediation: if an insider threat was detected, adjust permissions; if an account was compromised, change passwords and review access history; if data was improperly published, delete the publication and notify consumers, (5) post-incident review: what allowed this incident to happen, how do we prevent recurrence.
An analytical failure might be: a dashboard using stale data (integration failed, data is 3 days old instead of daily), a metric that is calculated wrong (formula bug in Datasphere model), or a data quality issue (values that violate known constraints). The response playbook: (1) Detect: monitoring alerts on data freshness, data quality rules fail, or users report incorrect numbers, (2) Assess: is the dashboard/metric still valid for use or should it be retracted, which decisions might have been made based on the incorrect data, (3) Notify: alert stakeholders who consume this analytics asset, (4) Correct: fix the root cause (repair the integration, fix the formula, clean the data), (5) Restore: republish corrected analysis, optionally publish a historical corrected view if needed, (6) Prevent: implement monitoring to catch similar issues faster next time.
A well-documented incident playbook includes: clearly defined roles (incident commander, technical lead, communications lead, executive sponsor), escalation criteria (when is an incident considered "major" warranting CEO notification), communication templates (how to notify affected users, what to say), and timeline SLAs (incident must be acknowledged within 15 minutes, containment within 1 hour, root cause within 4 hours). The governance team typically owns the playbook and runs tabletop exercises (simulated incidents) quarterly to ensure the team can execute it under pressure. When real incidents occur, having practiced the playbook reduces panic and ensures coordinated response.
After an incident is resolved, a post-incident review (blameless retrospective) answers: what were the sequence of events that led to this, where did controls fail to prevent it, what are we implementing to prevent recurrence, and what did we learn that applies more broadly. A data leakage incident due to misconfigured file sharing permissions, for example, might lead to: (1) new process requiring that any shared story/export is reviewed by a governance admin before external sharing, (2) tighter sharing and export rights for sensitive stories through SAC roles, teams, and folder sharing, (3) communication campaign reminding teams that data sensitivity is everyone's responsibility. Trust recovery requires not just fixing the immediate issue but demonstrating systemic changes that prevent recurrence. Communicating those changes to affected stakeholders—"here is what we found, here is what we changed"—rebuilds confidence.
Governance creates value when it enables safe change rather than blocking it. These composite scenarios show how organizations build control models that increase trust, accelerate analytics delivery, and stay compliant.
A financial institution's audit cycles take months of manual verification because the path from source systems through analytics to reporting was not transparent. Auditors cannot trace a KPI to its definition.
After a major acquisition, a pharma company has two ERPs, two versions of customer codes, two product hierarchies. Analytics teams cannot produce a unified customer or product view.
Organizations deploying Joule, intelligent content, and agents face a governance gap: if AI makes recommendations, who is accountable? Which data was used? Are the outputs auditable?
Sapphire 2026 update. SAP Sapphire 2026 gave agent governance a dedicated home: the SAP AI Agent Hub, built on SAP LeanIX, as a single command center to discover, manage, and govern all agents (SAP and non-SAP) — generally available Q3 2026 and included at no additional charge. SAP Master Data Governance moved natively into SAP Business Data Cloud, and the Joule Studio runtime sandboxes each agent via NVIDIA OpenShell. Read the full analytics-lens analysis →