A Practitioner's Map

The SAP Analytics Landscape in 2026

Every few years the SAP analytics portfolio is rearranged enough that the mental model practitioners carried into a project no longer matches what they find when they open the tenant. 2026 is one of those years. In my advisory work I now spend the first hour of most architecture workshops simply re-drawing the map, because the names on the boxes have changed, the commercial boundaries between products have moved, and a layer that SAP launched in February 2025 — Business Data Cloud — now sits underneath almost everything. This page is the map I draw. It walks the landscape one layer at a time, from where business users actually live down to the platform that runs it all, and it is opinionated about what matters and what is noise. It is a companion to the deeper three-layer architecture article; here the goal is orientation, not configuration detail.

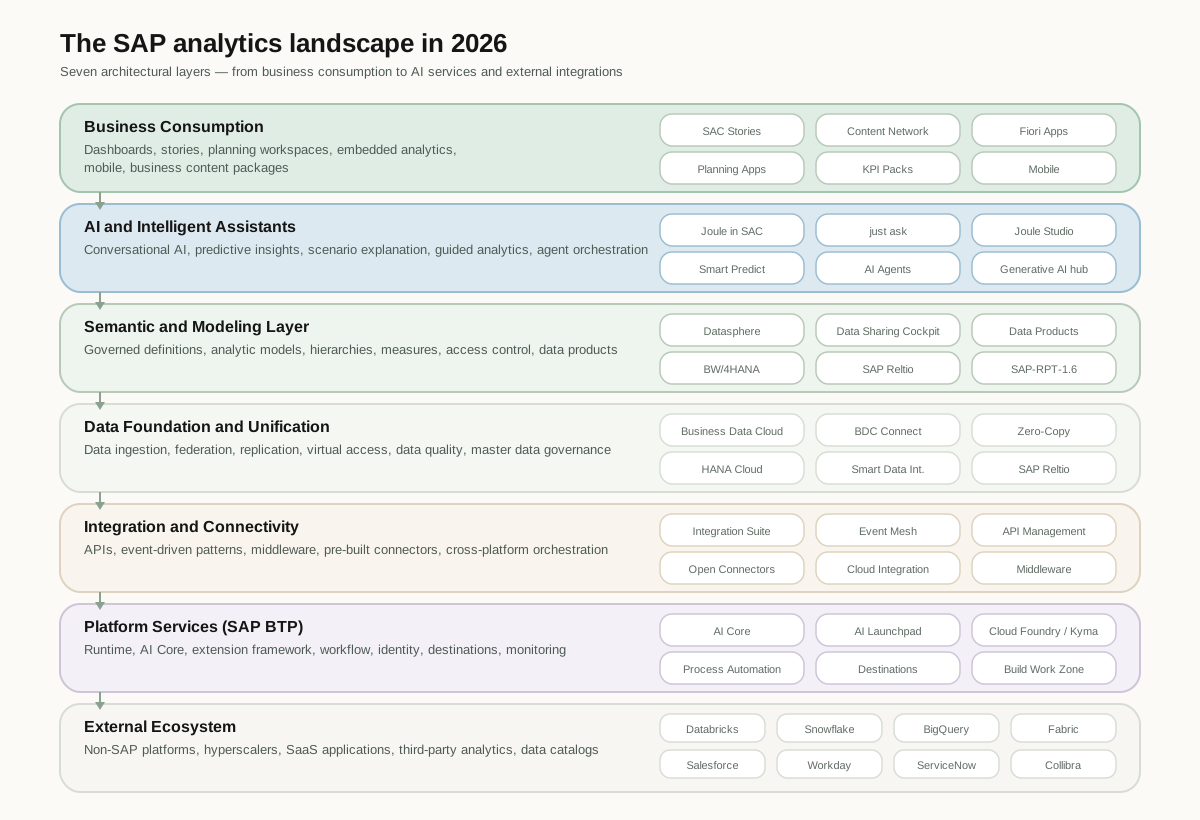
SAP analytics landscape 2026 layered map
The SAP analytics landscape in 2026, read as horizontal layers: consumption at the top, the semantic and modeling engine in the middle, the data unification platform underneath, and integration and AI services running alongside. Each section below walks one band of this map.

A landscape map is only useful if you read it the right way. The temptation is to treat it as an org chart of products — a list of things SAP sells — and to ask which one you should buy. That framing produces bad architecture. The better reading is functional: each layer answers a different question, serves a different audience, and changes at a different speed. The consumption layer changes weekly because it faces end users. The platform layer changes on the timescale of contracts and migrations. When you keep those clocks separate in your head, the portfolio stops looking like a confusing pile of overlapping tools and starts looking like a stack with clear seams.

Throughout this page I use first person because these are field observations, not a vendor brief. Where SAP has stated a firm date or capability I cite it; where the roadmap is genuinely uncertain I say so rather than inventing precision. If you remember one thing, let it be the shape: consumption sits on a governed semantic layer, the semantic layer sits on a unified data foundation, and AI now threads through every band rather than living in a box of its own.

Why the landscape looks different now

The single biggest reason the 2026 map does not match the 2023 map is commercial, not technical. Since January 1, 2026, SAP Analytics Cloud and SAP Datasphere can no longer be bought with SAP BTP cloud credits (BTPEA, CPEA, or pay-as-you-go) for new subscriptions; SAP's pricing pages license both through SAP Business Data Cloud and its Capacity Units. Credits bought before 2026 run to the end of their term and existing tenants were moved under BDC without a technical migration, so for a while you will see both worlds in the field — tenants bought the old way and tenants bought the new way — but the direction is unambiguous. The question a new buyer faces is no longer "Analytics Cloud or Datasphere?" It is "how much capacity does our decision-support estate need, and which workloads draw on it?" That reframing is the reason I have to re-draw the map for so many teams: the boxes they remember as products you purchase are now capabilities you draw down.

The second reason is architectural. For most of the last decade, SAP's analytics story was a stack of two layers — a consumption tool and, beneath it, a modeling layer that reached back into source systems. Business Data Cloud inserts a genuine third layer: a unified data foundation that brings SAP application data, HANA Cloud, the BW estate, master data, and the partner engines SAP Databricks and SAP Snowflake under one governed roof. That layer did not meaningfully exist when many practitioners last refreshed their picture of SAP analytics, which is why so many architecture conversations in 2026 start with someone discovering a box on the diagram they have never had to reason about before.

The third reason is AI, and specifically the shift from AI-as-feature to AI-as-fabric. In the old map you could point to "the AI part" — a smart-insights panel, an automated forecast. In 2026 the natural-language front door (Joule) reaches across consumption, modeling, and the data foundation, and SAP has introduced foundation models built specifically for enterprise tabular data rather than only re-using large language models designed for prose. The practical effect is that AI is no longer a layer you can isolate; it is a service band that touches every other band. I treat it that way on this map, and the closing sections explain why that distinction changes how you govern it.

The short version: a commercial reorganization (Capacity Units under Business Data Cloud), an architectural addition (a real data-unification layer), and an AI shift (from feature to fabric) together explain why the 2026 landscape feels unfamiliar even to people who have worked with SAP analytics for years. None of the individual products vanished; the relationships between them changed.

Layer 1 — SAP Analytics Cloud: where business users live

At the top of the map is the surface that almost everyone in the business actually touches: SAP Analytics Cloud. If you ask a finance controller, a regional sales lead, or a supply-chain planner where "the analytics" are, they will describe Analytics Cloud, because it is where decisions get made — where a number is read, a forecast is adjusted, a plan is committed. Everything else on this page exists to make that surface trustworthy. Analytics Cloud is deliberately not the place where business meaning is defined or where fine-grained data governance is enforced; those concerns belong one layer down. Keeping that boundary clean is, in my experience, the difference between a tenant that scales and one that calcifies into thousands of inconsistent stories.

Functionally, this layer carries four jobs. It is the reporting and exploration surface, where governed models are turned into stories and dashboards. It is the enterprise planning surface, where versioned, write-back planning runs on the same governed foundation as reporting rather than on a private island of imported data. It is the predictive surface, where Smart Predict brings forecasting, classification, and regression into the analytics and planning flow without a separate tool. And, increasingly, it is the conversational surface, where Joule lets a user ask a question in natural language instead of building a query by hand. Those four jobs are why I tell teams to treat Analytics Cloud as a consumption-and-decision layer, full stop — not as a modeling tool that happens to draw charts.

Reporting and Stories

The reporting experience in Analytics Cloud has converged on a single, responsive Story model — one editing and viewing experience that behaves consistently across desktop and mobile, rather than the older split between different story types and a separate application-design mode (SAP retired the Classic Experience, including analytic applications, at the end of Q2 2026). For practitioners this convergence matters more than it sounds. It means the thing a designer builds and the thing a consumer opens are the same artifact, which removes a whole category of "it looked fine in design mode" surprises. It also means the skills you invest in transfer cleanly, because you are not maintaining two parallel authoring paradigms.

The architectural discipline I push hardest on at this layer is to keep modeling logic out of the story. A story should reference a governed model and lay out the narrative — the headline, the breakdown, the trend, the variance call-out. It should not be the place where a measure is first defined, where a currency conversion is hand-rolled, or where a hierarchy is improvised. The moment business logic lives inside individual stories, you have as many definitions of "net revenue" as you have authors, and no layer underneath can save you. Push that logic down to the semantic layer and the story becomes a thin, fast, replaceable presentation of trusted numbers. This is the single most consequential habit separating a healthy Analytics Cloud estate from a sprawling one, and it is why the next layer down is the one that really determines whether your landscape holds together.

Planning deserves a specific note because it is where Analytics Cloud earns its keep beyond what a generic BI tool offers. When planning data is stored in the governed Datasphere layer (seamless planning) rather than in a separately imported copy, reporting and planning finally share the same dimensions, hierarchies, and measure definitions. The actuals a controller reviews and the plan they commit reference one foundation. Closing that loop — read and write on the same governed context — is the capability I most often use to justify Analytics Cloud over a reporting-only competitor, and it is a property of the architecture, not a feature you toggle on. For how this surface relates to the modeling layer in detail, the Analytics Cloud vs Datasphere comparison is the page I point teams to, and for how it stacks up against a non-SAP consumption tool, the Analytics Cloud vs Power BI comparison covers the trade-offs.

Design principle: Analytics Cloud is optimized for exploration, collaboration, planning, and action. It is not the system of record for business meaning. Define measures, hierarchies, and access once in the layer below; let stories and plans consume them. A clean boundary here is what lets the consumption layer change fast without fragmenting the truth underneath it.
Layer 2 — SAP Datasphere: the semantic and modeling engine

One layer down from the surface sits SAP Datasphere, and this is the layer that, more than any other, determines whether your landscape is coherent. Datasphere is where business meaning is defined: where a fact becomes an analytic model, where dimensions and hierarchies are given shape, where row-level security is enforced through data access controls, and where lineage from source through transformation to consumption is captured and made auditable. If Analytics Cloud is where people read the numbers, Datasphere is where the numbers are made to mean something consistent. I describe it to executives as the semantic engine — the place that turns raw, system-specific tables into governed business concepts that every consumption surface can share.

The organizing primitive at this layer is the Space — a governed container that lets a business domain model its data with its own access rules while still drawing on a shared semantic foundation. Spaces are how you let Finance and Supply Chain each own their modeling without each reinventing "customer" or "material" from scratch, and without one domain's mistakes leaking into another's reports. On top of Spaces sit analytic models (the fact-and-dimension definitions that carry measures, attributes, and hierarchies) and data products — named, owned assets published for reuse (in BDC, custom data products are published from Datasphere file-space tables through the Data Sharing Cockpit) so that reuse becomes governed rather than improvised. Data products are important enough to the 2026 picture that they have their own deep treatment in the data products guide; on this map, what matters is that Datasphere is where they are modeled and where their governance is anchored.

The shift Datasphere represents is the one I find hardest to convey to teams who grew up putting logic in reports: it moves semantic definition out of dashboards and into a dedicated, shared layer. That sounds abstract until you have lived through its absence. Without a semantic engine, every team encodes its own version of the rules, and "why don't these two reports agree?" becomes a permanent tax on the organization. With one, you define a concept once and every downstream consumer — Analytics Cloud stories, planning models, even external tools — inherits the same definition. The discipline of semantic modeling is, to my mind, the highest-leverage skill in the entire SAP analytics estate, precisely because it is the layer that everything above it trusts. For where exactly this layer should live relative to the platform underneath it, the semantic-layer placement architecture works through the trade-offs in depth.

Key shift: Datasphere relocates business meaning from individual reports into a governed, reusable layer. Define a measure, a hierarchy, or a security rule once here, and consistency flows upward to every consumption surface. This is the layer that makes governance, reuse, and trust possible — or, in its absence, impossible.

Layer 3 — SAP Business Data Cloud: the enterprise data unification layer

Underneath the semantic engine sits the layer that genuinely reshapes the 2026 map: SAP Business Data Cloud (BDC). The most common mistake I correct is the assumption that BDC is "a new analytics product." It is better understood as a unification layer and a commercial container — the place where SAP application data, HANA Cloud as the data foundation, SAP Master Data Governance as the master-data layer, the existing BW estate (as SAP BW, private cloud edition), and the partner engines SAP Databricks and SAP Snowflake are brought together under one governed roof and one capacity-based commercial model. Analytics Cloud and Datasphere now live inside this container rather than beside it, which is exactly why the buying conversation changed at the start of 2026.

Three things sit at the heart of this layer. First, a unified data foundation: rather than analytics reaching opportunistically into a dozen source systems, BDC establishes a governed foundation that the semantic layer models against. Second, master data as a first-class concern: SAP's acquisition of Reltio, completed May 7, 2026, brings multi-domain master data management and entity resolution into BDC as a native capability rather than a third-party bolt-on (SAP Reltio in SAP BDC has been generally available since October 2026), which matters because so many analytics trust problems are really master-data problems wearing an analytics costume. Third, data products as the unit of sharing: the governed, reusable data products (SAP-managed, or custom ones published from Datasphere) are cataloged and shared here, including — through BDC Connect — to non-SAP platforms without copying the data. That last capability is significant enough that I treat integration as its own band later on this map.

The practical consequence of this layer is that it changes the economic question. Under Capacity Units, you no longer reason in terms of "how many stories will we publish" or "how many modeling seats do we need." You reason in terms of total decision-support capacity across consumption, modeling, and the data foundation, drawn from a shared pool. For architects this is liberating and dangerous in equal measure: liberating because it removes artificial per-tool boundaries that used to distort design, and dangerous because capacity that is easy to draw down is also easy to waste. The teams that do well treat capacity the way a mature cloud team treats spend — with ownership, monitoring, and a deliberate sense of what is worth running. If you want to see exactly where the line between Datasphere and BDC falls, the Datasphere vs Business Data Cloud comparison is the page that pulls them apart cleanly.

Why this matters: Business Data Cloud is the seam where SAP application data, the data foundation, master data, the BW estate, and the partner engines meet. It is a unification layer and a commercial model, not a fourth dashboarding tool. Reason about it in terms of governed capacity and shared data products, not in terms of charts.

SAP BTP — the platform runtime everything stands on

Beneath the three analytics layers, and easy to forget precisely because it is rarely the thing you open, runs SAP Business Technology Platform (BTP). Every analytics and integration service on this map executes on BTP, which SAP now positions as a core part of the SAP Business AI Platform. It is not a separate analytics product and it is not optional knowledge: it is the modular cloud foundation that hosts the runtime for custom models (AI Core, with the generative AI hub), the application runtimes for extensions and custom microservices (Cloud Foundry, and Kyma as SAP-managed Kubernetes), and the low-code automation for approval and event-driven processes (SAP Build Process Automation). When a project needs an extension, a custom service, or a place to run a bespoke model alongside the governed semantic layer, that work lands on BTP.

The reason I keep BTP on the map even though business users never see it is that the analytics platform is a cloud application, not a self-contained appliance. The moment a landscape grows beyond out-of-the-box capability — a custom integration, an embedded prediction, a tailored workflow — it reaches into BTP services. Architects who treat BTP as background scenery tend to discover, late and expensively, that the extension they need has nowhere clean to live. The BTP guide works through where analytics genuinely benefits from BTP and, just as importantly, where reaching for it is over-engineering. The companion integration vs platform-extension boundaries piece is the one I use to keep teams from building on BTP what should simply be configured in the layers above.

AI — Joule, SAP-RPT, and the shift from feature to fabric

On this map I draw AI as a band that runs alongside the others rather than as a box inside any single layer, because that is how it now behaves. The front door is Joule, SAP's natural-language assistant, which has become the main conversational entry point across the portfolio — its analytical insights for Analytics Cloud run on just ask, SAC's natural-language query feature, which still exists inside SAC as well, so the ways to ask a question in plain language are converging on Joule rather than multiplying. Joule reaches into the consumption surface, the semantic layer, and the data foundation, which is exactly why it does not sit cleanly in any one of them.

The more interesting development for practitioners is underneath the assistant. SAP introduced SAP-RPT-1, a relational pretrained transformer — a foundation model built specifically for enterprise tabular data, using in-context learning rather than the prose-oriented design of a general large language model. SAP's own framing is striking: relative to LLMs it claims roughly "50,000 times less energy, 100,000 fewer GPU FLOPs, up to 3.5× better predictions and 50× more speed" on the tabular tasks it targets. Whether or not every one of those figures generalizes to your workload, the strategic point is that SAP is betting tabular enterprise data deserves purpose-built models rather than only repurposed text models. The family has moved on since: SAP-RPT-1.6 is generally available in the SAP AI Core model library, tabular orchestration runs as a managed workflow on the generative AI hub (since September 2026), SAP-RPT-TS is generally available for time-indexed metrics, SAP-RPT-2 is planned for Q1 2027, and SAP-RPT-1 retires by December 31, 2026. I keep SAP-RPT-2 on the map as a forward marker rather than a present-tense capability, and I am careful to date it honestly.

The reason the feature-to-fabric distinction matters is governance, which is the subject I return to in the closing note. When AI was a panel, you governed the panel. When AI is a fabric that can read across the semantic layer and the data foundation and answer in natural language, you have to govern the meaning it draws on and the trust it implies, not just the widget it appears in. That is an architecture problem, and it is one I explore at length in the essay on the future of business intelligence in the AI era. On this map, the takeaway is narrow and important: AI is no longer a destination you navigate to; it is a capability threaded through everywhere, which is precisely why it cannot be governed as an afterthought.

Integration — BDC Connect and the multi-cloud reality

No serious enterprise keeps all its data inside SAP, and the 2026 landscape finally treats that as a first-class fact rather than an inconvenience. The mechanism is BDC Connect, which lets governed SAP data products be shared with — and external data be reached from — major non-SAP platforms without copying the data. Zero-copy is the operative idea: instead of exporting data to each platform (expensive, stale, duplicative), consumers reference a single governed source of truth, with each partner platform governing access to the shared objects with its own controls. For organizations whose analytics already live partly in a cloud data warehouse or lakehouse, this is the capability that changes the architecture conversation, because it removes the assumption that using SAP analytics means re-ingesting everything into SAP first. The broader patterns for stitching SAP and non-SAP estates together are the subject of the integrations hub and the non-SAP integration patterns page.

Where this gets practical — and where I insist on precision, because the dates move and reputations ride on getting them right — is the connector availability. As of November 2026 the picture is:

BDC Connect connector status (be precise about these)

  • Databricks: generally available since October 2025. This is the most mature connector and reflects the deep Databricks partnership that underpins the lakehouse compute inside Business Data Cloud itself.
  • Snowflake: general availability reached May 4, 2026. SAP data products surface in Snowflake as native objects under Snowflake-native governance, shared zero-copy.
  • Google BigQuery: generally available since July 2026 (for BDC on Google Cloud and AWS; Azure-hosted BDC to follow).
  • Microsoft Fabric / OneLake: announced at Microsoft Ignite in November 2025 and still in public preview in November 2026, with general availability now planned for the second half of 2026 (originally Q3 2026). Roadmap rather than present-tense.

Amazon Athena joined the plan at SAP Sapphire 2026 (May 12), with general availability planned for the first half of 2027. I labor over those distinctions because the gap between "announced," "planned," and "generally available" is where bad architecture decisions get made. A connector that is planned for next quarter cannot be the load-bearing assumption in a design you are committing to this quarter. When I build a target architecture on this layer, I draw GA connectors as solid lines and planned ones as dashed, and I make the client say out loud which is which. The economic promise of zero-copy is real, but it is only collectable on connectors that have actually shipped. For a head-to-head on where a lakehouse-style warehouse fits relative to the SAP semantic layer, the Datasphere vs Snowflake comparison is the page that frames the choice without the marketing gloss.

BW modernization — the estate you are migrating from

The last band on the map is the one most likely to be overlooked in a glossy product diagram and most likely to dominate a real project plan: the existing SAP BW estate. The majority of established SAP customers did not arrive at the 2026 landscape from a clean sheet; they arrived from years of BW/4HANA or older NetWeaver-based warehousing, with InfoProviders, queries, and business logic that the organization genuinely depends on. Any honest map has to show where that estate connects, because for most enterprises the journey is not "build the new landscape" but "modernize into it without breaking what works."

The good news is that modernization in 2026 is no longer an all-or-nothing rebuild. BW workloads can run alongside the new layers as SAP BW, private cloud edition inside BDC: its Data Product Generator replicates InfoProvider data into the BDC object store as custom data products (InfoObject hierarchies are not supported yet), and the Query Template Generator moves BW queries and their dependent objects to Datasphere — so modernization no longer starts with re-modeling everything by hand. That changes modernization from a cliff into a ramp. The decision I help teams make is rarely "BW or not"; it is "which parts of the BW estate earn a move now, which keep running as they are for the moment, and which were never worth the complexity in the first place." The Analytics Cloud vs BW comparison and the more pointed "modernize BW or does it still fit?" comparison are the two pages I lean on when a client needs to make that call with evidence rather than nostalgia.

The reason BW belongs on a 2026 landscape map at all is that ignoring it produces fantasy architectures. A diagram that shows only the shiny new layers, with no acknowledgment of the warehouse that currently runs the month-end close, is not a map — it is a brochure. Showing the modernization path honestly, including the parts that stay put for now, is what makes the rest of the landscape credible to the people who have to live in it.

How to read this landscape — a practitioner's note

If you take this map into your own organization, a few habits will keep you from misreading it. The first is to read it as functions, not products. The boxes are not a shopping list; they are roles. Ask of any requirement which layer should own it — consumption, semantics, data foundation, platform, integration — before you ask which product to open. Most of the worst SAP analytics architectures I have seen came from putting a job in the wrong layer: modeling logic stranded in stories, integration improvised inside dashboards, custom code on BTP that should have been configuration in Datasphere.

The second habit is to respect the different clocks. The consumption layer changes fast and forgivingly; you can redesign a story on a Friday. The platform and contract layers change slowly and expensively; a migration or a capacity commitment is a multi-quarter affair. Design so that the fast-changing surface sits on slow-changing, governed foundations, and you get the best of both — agility on top, stability underneath. Invert that, and every small change at the bottom ripples destructively through everything above.

The third habit is to be ruthless about dates. This landscape mixes shipped capability with announced roadmap, and the two must not be drawn with the same pen. Databricks, Snowflake, and BigQuery connectivity has shipped; Fabric is in preview and Athena is planned; SAP-RPT-2, announced at SAP TechEd 2026, is planned for Q1 2027. A target architecture is only as sound as the honesty of its assumptions, so separate what exists from what is promised and make every stakeholder acknowledge the difference. I have never regretted being the person in the room who insists on that distinction.

The fourth habit is to let governance follow meaning. The reason the semantic layer sits where it does on this map — between the people who consume numbers and the data that produces them — is that it is the natural place to enforce trust. Define meaning once, secure it once, make it auditable once, and let every surface above inherit it. In an AI-threaded landscape this is no longer optional hygiene; when a natural-language assistant can answer across the whole stack, the trustworthiness of its answers is exactly the trustworthiness of the semantic layer underneath. Govern the meaning, and you govern the AI. The governance hub goes deeper on the controls that make this real.

Finally, treat this map as a starting point, not a destination. It is deliberately an orientation layer — enough to place every major piece of the SAP analytics portfolio and understand how the pieces relate. When you are ready to go deeper, the natural next steps are the three-layer architecture article for how the layers actually exchange data, the architectures hub for the harder boundary decisions, the comparisons hub when you need to choose between two specific options, and the learning path if you are building the skills to work across these layers. The map tells you where things are; those pages tell you what to do once you are standing there. Definitions for any unfamiliar term on this page live in the glossary, and the curated external references sit in the resource center.

The one-paragraph map: Business users live in SAP Analytics Cloud (consumption, planning, conversation). It stands on SAP Datasphere, the semantic engine where meaning, security, and reuse are defined. That stands on SAP Business Data Cloud, the unified data foundation and capacity-based commercial model that brings application data, HANA Cloud, master data, the BW estate, and the partner engines SAP Databricks and SAP Snowflake together. All of it runs on BTP. AI (Joule, the SAP-RPT models) threads through every layer rather than sitting in one. Integration via BDC Connect reaches non-SAP platforms zero-copy — Databricks, Snowflake, and BigQuery today, Fabric and Amazon Athena on the roadmap. And the BW estate connects in along a modernization ramp, not a cliff.

When this map applies

Use it when you need to orient a stakeholder, a new architect, or yourself in the SAP analytics portfolio of 2026 — to place every major product in a layer and understand how the layers relate. It is an orientation page, not a configuration manual; it explains the shape, not the settings.

When you need to go deeper

When you have to make a specific choice or design a specific boundary, move to the dedicated pages: the three-layer architecture for data flow, the architectures hub for boundary decisions, or the relevant comparison for a head-to-head.