SAP Analytics 15-Week Learning Path
Most people who set out to learn SAP analytics fail in the same way: they collect tabs. They open a dozen courses, bookmark twice as many articles, and end up with breadth they cannot connect and depth they never reach. In my advisory work I have watched capable analysts spend six months busy and learn almost nothing transferable, because nobody told them the one thing that matters most — the order. This page is the route I would give a motivated beginner on day one. It runs for fifteen weeks across five stages, it forces you to build something real at each step, and it ends with you able to make an architectural judgment rather than just operate a screen. You do not need to finish it in fifteen calendar weeks. You do need to finish it in this sequence.
Before you learn anything — understand what you are learning
The single most common reason people stall on SAP analytics is that they treat three different products as one product. They hear "SAP analytics," they open SAP Analytics Cloud, they build a chart, and then they are confused for the next year because the platform keeps referring to things — Spaces, Analytic Models, data products, capacity units — that live somewhere else entirely. So before any course, any trial, any tutorial, spend an afternoon getting the shape of the platform into your head. If you internalize nothing else from this page, internalize the next four paragraphs. They will save you months.
SAP Analytics Cloud (SAC) is where business users live. It is the consumption surface: the place where people open a dashboard, read a story, type a question, run a forecast, and enter a planning number. When a finance manager looks at a budget-versus-actuals view, when a sales director filters a regional pipeline, when an executive asks a natural-language question and gets a chart back, they are in SAC. SAC owns two big jobs — business intelligence (stories, dashboards, the visual and interactive layer) and enterprise planning (manual data entry, version management, allocations, forecasting). What SAC does not own, and this is the part beginners get wrong, is the definition of business meaning. SAC consumes meaning; it does not author it. If you find yourself building heavy transformation logic inside a story, you are using the wrong layer.
SAP Datasphere is where meaning is defined. It is the semantic and modeling engine — the layer where an architect decides what "customer" means, what "net revenue" means, which rows a given user is allowed to see, and where a number ultimately comes from. Datasphere organizes work into Spaces, exposes governed Analytic Models, carries data access controls and lineage, and increasingly publishes governed assets as data products. The mental model that unlocks everything: Datasphere defines the truth once, and SAC reads that same truth everywhere. When a planning model and a reporting dashboard both sit on the same Datasphere model, they cannot disagree about what revenue is. That is not a convenience. It is the entire point of having a semantic layer, and it is why "should I learn SAC or Datasphere?" is the wrong question — you will eventually need both, in this order.
SAP Business Data Cloud (BDC) is the commercial and platform envelope around the two. BDC is not a fourth tool you log into to build a chart; it is the bundle and the data-unification layer that brings SAC, Datasphere, SAP HANA Cloud, master data, BW modernization, the partner engines SAP Databricks and SAP Snowflake, and zero-copy connectivity (BDC Connect) together under one commercial model. This matters to a beginner for one concrete, recent reason: since January 1, 2026, SAC and SAP Datasphere can no longer be bought with SAP BTP cloud credits (BTPEA, CPEA, or pay-as-you-go) for new subscriptions, and SAP's pricing pages now license both through Business Data Cloud capacity units (credits bought before 2026 run to the end of their term, and existing tenants were moved under BDC without a technical migration). So when you read older material that talks about "buying SAC," understand that the commercial story has changed even though the products you actually learn — stories, models, planning — have not. You learn SAC and Datasphere as skills; you buy them, today, as BDC.
Two more orientation points, because they trip up almost everyone. First, "live" versus "import" is a real architectural decision, not a checkbox. A live connection queries the source system in place and never copies the data into SAC; an import (acquired) model pulls a snapshot into SAC's in-memory store. Each has consequences for performance, freshness, planning capability, and governance, and a surprising amount of early confusion ("why is my data stale?", "why can't I plan on this model?") comes from not understanding which mode you are in. Second, Joule is the natural-language front door. Joule is SAP's AI assistant across SAP Business AI, and its analytical insights for SAC run on just ask, SAC's natural-language query feature, which still exists inside SAC as well. You do not need to master either early, but you should recognize both names so you know they are one capability family rather than separate products to hunt for.
There is one more piece of orientation that is less about the products and more about how SAP itself is moving, because it changes what "the platform" even means while you are learning it. SAP has spent the last two years pulling its analytics and data assets together under Business Data Cloud and weaving AI through the whole thing under the Joule front door. You will encounter names like SAP-RPT (SAP's tabular foundation models, built for the kind of structured, columnar data analytics actually runs on rather than free text—SAP-RPT-1.6 is the current generally available version, and the original SAP-RPT-1 retires by the end of 2026), SAP Knowledge Graph, and a growing catalog of Joule skills and agents. You do not need any of this to build your first dashboard, and I would actively discourage a beginner from starting there — but you should recognize the direction so that when a course or a colleague mentions it, you can place it. The direction is: more governed data products, more semantic context traveling with the data, and more AI sitting on top of that governed foundation rather than bolted onto raw tables. Everything in this roadmap is designed to put you on the right side of that direction — building on shared meaning, not private logic — so that the AI layer, when you reach it, has something trustworthy to stand on.
Hold this orientation loosely but firmly. You will not understand every term yet — Spaces, capacity units, data products, BW Bridge — and that is fine. The roadmap below introduces each one at the point where you can actually use it. What you need right now is the skeleton: three layers, a defined order, and the discipline to resist jumping ahead. The diagram below is the same skeleton drawn as a route. Read it before you read the stages.
Who this path is for, and how to pace it
This roadmap is written for the motivated beginner — someone who can already use a spreadsheet, has some exposure to business data, and wants to become genuinely capable in SAP analytics rather than merely conversant. It works whether you are a recent graduate trying to break into the field, an analyst from another stack (Power BI, Tableau, a SQL background) crossing over, a finance or operations professional who has been handed SAC and told to "make it work," or a consultant who needs to get productive fast. It is not written for someone who only wants to pass a certification exam as quickly as possible; if that is your single goal, you can move faster and thinner, but you will not build the judgment this path is designed to produce, and the gap will show the first time you face a real decision.
On pacing: the "fifteen weeks" is a structure, not a stopwatch. I have deliberately expressed the plan in weeks rather than hours because the calendar enforces spacing, and spacing is how skills consolidate — you learn more from five focused hours spread across a week than from a single fifteen-hour weekend that you forget by Wednesday. If you can give this serious time, treat each "week" as roughly five to eight hours of focused effort: some reading, some watching, and — non-negotiably — some building. If you only have an evening or two a week, simply let each stage take longer; the order is what matters, not the speed. The one pacing rule I will insist on is this: do not advance to the next stage until you have produced that stage's proof artifact. The artifacts are the checkpoints. They are how you know the learning is real and not just a comfortable feeling of having watched some videos. An honest "I have not built it yet" is worth more than a dishonest "I think I understand it."
A note on environment, because beginners often stall here: you do not need a paid tenant to start. The free, self-paced SAP Learning content (covered in detail in the resources section below) lets you learn the concepts and follow along, and SAP periodically offers trial access to the products themselves so you can practice hands-on. Where you cannot get hands on a live system for a particular step, do not let that block you — design the artifact on paper or in a spreadsheet. A role matrix, a lifecycle note, a responsibility map, and a design rationale are all things you can produce and defend without a running tenant, and they teach the thinking that the clicking alone never does. The clicking is the easy part to pick up later; the thinking is the part worth front-loading now.
The five-stage learning roadmap
The roadmap has five stages spread across fifteen weeks. Each stage names its weeks, states its goals in plain terms, tells you exactly what to build, and — most importantly — ends with a proof artifact: a concrete, shareable thing that demonstrates the skill is real. The artifact is not busywork. It is the difference between "I watched a course on planning" and "here is a planning model with a version strategy and a working forecast that I designed and can defend." In hiring, in internal moves, and in consulting staffing, the artifact is what gets believed. The course completion is not.
The stages are deliberately front-loaded with foundations and back-loaded with judgment. Stages I and II make you capable — you can build a sound story and a sound model. Stage III makes you governed — your work sits on shared meaning instead of private logic. Stage IV makes you trustworthy to operate — you understand security, lifecycle, and the things that keep a tenant from quietly degrading. Stage V makes you architectural — you can decide where a capability should live and why. Do not skip toward Stage V. The most damaging beginners I have met are the ones who learned to talk about architecture before they could build the thing they were drawing boxes around.
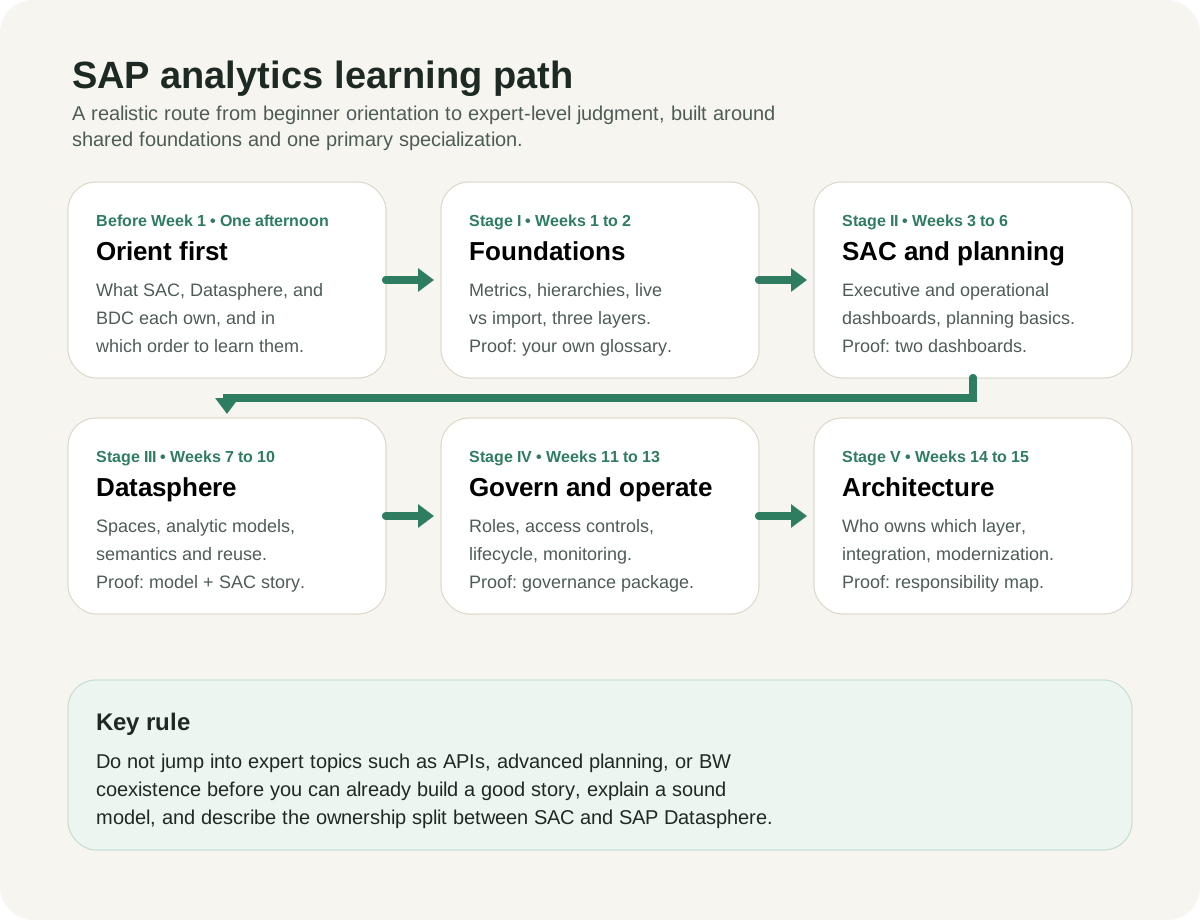
The five-stage route across fifteen weeks. The rule at the bottom is the one most people break: do not reach for APIs, advanced planning, or BW coexistence before you can already build a good story, explain a sound model, and describe the SAC–Datasphere ownership split.
Stage I — Cloud & analytics foundations (Weeks 1–2)
Goal. Before you touch a single SAP screen in anger, get fluent in the vocabulary and the mental models that every later stage assumes. This is the stage people skip, and skipping it is why so many SAC users plateau as button-pushers. Two weeks here pays for itself ten times over.
What to learn.
- The shape of a metric. Learn the difference between a dimension and a measure, what a hierarchy is, why granularity matters, and what "additive", "semi-additive", and "non-additive" mean for a number. If you cannot explain why you cannot sum a closing headcount across months the way you sum revenue, you are not ready to model.
- Connection modes. Understand live versus import (acquired) data at a conceptual level — what each does to freshness, performance, planning capability, and governance. You will not configure connections yet, but you must know the trade-off exists.
- The three-layer split. Re-read the orientation above until the SAC / Datasphere / BDC ownership split is automatic. Read this site's Landscape 2026 map end to end; it is the single best way to see how the layers fit before you start clicking.
- Cloud and platform basics. Understand at a high level that all of this runs on SAP BTP (Business Technology Platform)—now a core part of the SAP Business AI Platform—what a tenant is, and why "it's a cloud service" changes how you think about upgrades, capacity, and extensions versus an on-premise BW system.
What to build. A one-page written glossary in your own words — not copied — defining fifteen core terms (dimension, measure, hierarchy, live connection, import model, Space, Analytic Model, story, planning model, version, data action, capacity unit, data product, semantic layer, BDC Connect). Writing the definitions yourself, in plain language, is the test. If you cannot write a clean definition of "semantic layer", you do not yet understand it, and this site's glossary is there precisely to calibrate yours against a working one.
Common mistakes at this stage. The first is skipping it entirely — diving straight into building a chart because foundations feel slow and abstract. The second is mistaking familiarity for understanding: you have heard the word "semantic layer" a hundred times, so you assume you know it, but when asked to define it in a sentence you produce something circular. The third is collecting vocabulary you cannot use — memorizing that "data action" exists without any sense of what it does or when you would reach for it. The cure for all three is the same: write your own definitions, in plain words, and test them on someone. How you will know you are ready for Stage II: you can explain to a non-technical friend, without notes, why SAC and Datasphere are different layers and why that separation is a feature rather than an annoyance. If that explanation is fluent, the foundation has set.
Stage II — SAC stories, dashboards & planning (Weeks 3–6)
Goal. Become genuinely good at the consumption layer. By the end of these four weeks you should be able to build a dashboard a real decision-maker would actually use, and you should understand — at least in outline — how SAC planning differs from SAC reporting, because conflating the two is one of the most expensive misunderstandings in the platform.
What to learn.
- Navigation and connections (Week 3). Learn the SAC environment: how to navigate, how to establish a connection, the difference between a model and a story, and the basics of acquiring or live-connecting data. The official foundation content is the right starting point here (see the resources section below); use it to learn the system's own names for things so you are not inventing your own.
- Story and dashboard design (Weeks 3–4). This is craft, not clicking. Learn chart selection (when a line beats a bar, when a table beats both), layout and visual hierarchy, filtering and linked analysis, and the discipline of designing for an audience. An executive dashboard and an operational dashboard are different objects with different rules — one answers "are we on track?" at a glance, the other supports someone doing a job all day. Build both, deliberately, and be able to say why each design choice serves its reader.
- Modeling basics inside SAC (Week 5). Learn enough SAC modeling to be dangerous: dimensions, measures, calculated measures, and why heavy transformation does not belong here. The lesson you are really learning is restraint — what to push downstream to Datasphere later.
- Planning, conceptually (Week 6). Learn what a planning model is, how versions (actual, budget, forecast) work, what manual data entry and data locking mean, and what a data action does at a high level. You are not aiming for mastery of advanced planning yet; you are aiming to never again confuse "a dashboard about the budget" with "a model people plan the budget in."
What to build. Two stories on a dataset you understand — ideally a small business dataset of your own, even a synthetic one. One is an executive dashboard: a single screen that answers the three questions a leader actually asks, with ruthless restraint about what earns a place. The other is an operational dashboard: denser, filterable, built for someone who works in it. For each, write a short rationale — why this chart, why this layout, why this filter, who the reader is. The rationale is what separates a designer from a chart-generator. To sharpen the craft, read this site's SAP Analytics Cloud deep dive and the practical SAC data modeling implementation guide alongside the build.
Common mistakes at this stage. The classic one is decoration over communication — every chart type the tool offers, gradients, a dozen KPIs crammed onto one screen, and no clear answer to "what is this for?" A dashboard is not a gallery of your skills; it is an instrument for someone else's decision, and restraint is the hardest discipline to learn. The second mistake is doing transformation work in the story that belongs downstream — calculated measures piled on calculated measures until the story is really a hidden, un-governed model that nobody else can reuse. You will undo most of that in Stage III, so notice the urge now and label it. The third is treating planning as "reporting with editable cells," which leads to genuine confusion the moment versions, locking, and data actions enter the picture. How you will know you are ready for Stage III: you can hand your operational dashboard to someone who does that job and watch them use it without asking you what anything means — and you can articulate, out loud, which pieces of logic in your stories ought to move down into a proper model.
Stage III — Datasphere modeling & semantics (Weeks 7–10)
Goal. Move from consuming meaning to defining it. This is the stage where you stop being "a SAC person" and start being someone who understands the platform. It is also where the learning curve genuinely steepens, so the schedule gives it four weeks. By the end, you should be able to build a small governed model in Datasphere and consume it from SAC — closing the loop between the two layers with your own hands.
What to learn.
- Datasphere fundamentals and Spaces (Week 7). Learn what a Space is (a governed container for modeling work, with its own access and resource boundaries), how connections and data tables work, and how Datasphere organizes a team's work without letting one team trample another's.
- Building Analytic Models (Weeks 7–8). Learn to model facts and dimensions, attach hierarchies and attributes, define measures, and expose a clean Analytic Model that a story can sit on. This is the core skill of the stage. Take a metric you "defined" inside a SAC story in Stage II and move its logic down into a proper Datasphere model — feel the difference in your own build.
- Semantics and reuse (Week 9). Learn why the same model can serve many consumers, what it means for a definition to be authored once and read everywhere, and how associations let you relate entities (orders to customers, customers to regions) so that meaning composes rather than duplicates. This site's semantic modeling guide and the Datasphere topic hub go deep here; read them while you build.
- Governed consumption and a first look at data products (Week 10). Connect SAC to your Datasphere model and build a small story on it, so you experience governed consumption directly. Then read about data products — named, owned, versioned assets that bundle semantic meaning with quality and access policy — as the direction this discipline is heading. Do not try to build a production data product yet; understand the concept and how this site's data products guide frames it. (SAP's announced Data Product Studio had no confirmed general availability as of November 2026; in BDC today, custom data products are published through the Data Sharing Cockpit.)
What to build. One governed semantic model in Datasphere — a fact with at least two dimensions, a hierarchy, and a couple of well-named measures — and one SAC story built on top of it. The artifact is the pair: model plus consumption. If you have only built a model, you have not proven you understand why it exists; the proof is a dashboard whose numbers you can trace back through the model to the source. If you can also sketch how that model would become a small data product (owner, version, quality note, who may consume it), you are already ahead of most working practitioners.
Common mistakes at this stage. The first is re-creating SAC habits in Datasphere — building a model so tailored to one dashboard that it can never be reused, which defeats the entire reason the layer exists. A good Analytic Model anticipates more than one consumer. The second is modeling without thinking about who is allowed to see what; security and reuse are easier to design in early than to retrofit, and a model that ignores access from the start tends to get rebuilt. The third, and most seductive, is over-engineering — discovering Datasphere's power and constructing an elaborate semantic cathedral for a problem that needed a single clean fact and two dimensions. Start small and correct; complexity earns its place only when a real requirement demands it. How you will know you are ready for Stage IV: you can point at a number on your SAC story and walk a skeptic backwards through the model to the source, naming each transformation, and you can explain why a second team could safely build on the same model without copying it.
Stage IV — Administration, security & governance (Weeks 11–13)
Goal. Learn the things that keep a tenant healthy, trusted, and under control — the unglamorous discipline that separates a hobby environment from a production one. You do not need to become a full-time administrator, but every serious practitioner must understand the security and lifecycle model, because the day you build something real, someone will ask "who can see this, and how do we move it to production without breaking it?" The schedule gives this three weeks.
What to learn.
- Roles, users, and the authorization model (Week 11). Learn how SAC and Datasphere handle users, roles, and permissions; what least-privilege means in practice; and the difference between what a user can open and what data a user can see. Row-level and object-level security are different mechanisms solving different problems — know which is which.
- Data access controls and the trust model (Weeks 11–12). Learn how Datasphere data access controls restrict rows by user attribute, why this belongs in the semantic layer rather than in each dashboard, and how lineage and auditability make governance defensible rather than merely claimed. This site's governance, security & admin hub and the Datasphere governance implementation guide are the right depth here.
- Lifecycle and transport (Week 12). Learn how content moves from development to test to production, what transport and content packaging look like, and why "I built it in production" is a sentence that ends badly. Even at beginner scale, practice promoting a story or model between environments or saved states so the concept is muscle memory.
- Monitoring and operating discipline (Week 13). Learn what to watch — usage, performance, failed data refreshes, capacity consumption — and why a tenant left unmonitored degrades quietly until users stop trusting it. A simple monitoring checklist is a real deliverable.
What to build. A small but complete governance package for an imagined deployment: a role matrix (who gets which role and why, framed around least privilege), a one-page lifecycle note (how content moves dev → test → prod, and the rule against building in production), and a monitoring checklist (what you would check, how often, and what action a red signal triggers). These three artifacts are exactly what a governance or admin owner is expected to produce, and producing them now — even at toy scale — teaches the operating mindset that pure feature-learning never does.
Common mistakes at this stage. The first is treating security as a bolt-on — building everything first and then trying to wrap roles around it, which always produces either dangerous over-permissioning ("just give everyone admin so it works") or a brittle tangle nobody dares to change. Least privilege is a design stance, not a cleanup task. The second is confusing "can open the object" with "can see the data" — a user might have access to a story while the row-level controls quietly restrict which records they actually see, and not understanding that distinction leads to both accidental exposure and baffled "why is my number different from yours" conversations. The third is romanticizing tooling while ignoring operating discipline — a perfectly modeled tenant with no monitoring and no lifecycle still rots, because failed refreshes go unnoticed and someone eventually edits production directly. How you will know you are ready for Stage V: you can describe, for a piece of content you built, exactly who can see it, how it would move from development to production, and what you would watch to know it is still healthy — without hand-waving on any of the three.
Stage V — Architecture & integration (Weeks 14–15)
Goal. Earn the right to draw the boxes. By now you can build a story, build a model, secure it, and operate it — so you can finally reason about where things should live, how SAP and non-SAP systems meet without losing meaning, and how to modernize without breaking what works. This is judgment, and judgment only sticks when it sits on the four stages beneath it. Two weeks is enough to start; this becomes a career-long muscle.
What to learn.
- Layer ownership and where the semantic layer belongs (Week 14). Learn the recurring architectural question — should business meaning live in BW, in Datasphere, in a non-SAP platform, or be spread across them? — and how to reason about it rather than guess. This site's architecture essay on where the semantic layer should live is built for exactly this decision.
- Integration boundaries and semantic checkpoints (Week 14). Learn how data crosses between systems — Cloud Integration, APIs, event-driven patterns, and zero-copy access via BDC Connect — and where a "semantic checkpoint" must sit so that meaning is not silently lost at a boundary. Start with this site's integrations hub and the boundary essay on integration versus platform-extension boundaries.
- Modernization routes (Week 15). Learn how organizations move from BW to a modern Datasphere-and-BDC footprint, what SAP BW, private cloud edition inside BDC (SAP's strategic route for existing BW systems), BW Bridge, and the BW Data Product Generator are for, and why "modernize or still fit?" is a question with a real answer rather than a slogan. The comparison BW: modernize or still fit? frames the choice.
- Reading the whole landscape (Week 15). Re-read the core platform relationships article now that you have built on every layer. It will read completely differently than it did before Stage I — that change in how it reads is the actual proof you have learned something.
What to build. A one-page responsibility map for a small imagined landscape — which layer owns ingestion, which owns semantics, which owns consumption, which owns planning, where the integration boundaries are, and where the semantic checkpoints sit — plus a short transition note describing how you would move one workload (say, a BW query) into the modern footprint without losing its meaning. This is the same artifact an enterprise architect is expected to produce, scaled down. Producing it forces every earlier stage to connect.
Common mistakes at this stage. The first is the one this whole roadmap is structured to prevent: drawing architecture before you can build. An architect who has never built a model produces diagrams that are internally tidy and practically impossible, because they do not feel the constraints the boxes hide. The second is treating integration as a pipes problem — "just move the data from A to B" — while ignoring that meaning is what actually has to survive the trip; a feed that delivers technically correct numbers stripped of their business context has lost the thing that made them worth moving. The third is dogmatism: insisting that the semantic layer must always live in Datasphere, or that everything must be zero-copy, or that BW is always legacy. Real architecture is contingent — it depends on where the data already lives, what the organization can operate, and what it is trying to decide. How you will know you have arrived: when someone challenges a specific choice on your responsibility map and you can defend it on its merits — or concede it on its merits — rather than retreating to a slogan.
How the stages fit together
Read the five stages as a single arc, not five separate courses. Foundations give you the vocabulary; SAC makes you useful; Datasphere makes you governed; administration makes you safe to put in production; architecture makes you someone whose opinion is worth asking. The proof artifacts accumulate into a portfolio that is far more persuasive than any certificate, because each one shows you did the thing, not just watched it. And the rule on the diagram — do not jump to expert topics before you can build a sound story and explain a sound model — is the guardrail that keeps the whole sequence honest. Every analyst I have seen ignore that rule produced confident architecture diagrams that fell apart the moment someone asked them to build the simplest box on the page.
A realistic week-by-week cadence
Some people want the plan as a calendar rather than as stages, so here is the same route laid out week by week. Treat it as a default to adapt, not a contract. If a week's build is not done, the honest move is to stay another week, not to advance on schedule with a half-finished artifact.
- Week 1 — Vocabulary. Metrics, dimensions, measures, hierarchies, additivity. Read the Landscape 2026 map. Begin your glossary.
- Week 2 — The three layers. Live versus import, tenants and BTP at a high level, the SAC–Datasphere–BDC split. Finish the glossary and the three-sentence explanation. Stage I artifact due.
- Week 3 — SAC navigation and first story. Connections, model versus story, build a first simple dashboard following the free SAC course.
- Week 4 — Design craft. Chart selection, layout, hierarchy, filtering, linked analysis. Start the executive and operational dashboards.
- Week 5 — SAC modeling basics and restraint. Calculated measures, and a running list of logic that should later move downstream.
- Week 6 — Planning concepts. Models, versions, data entry, locking, data actions at a high level. Finish both dashboards and their rationales. Stage II artifact due.
- Week 7 — Datasphere fundamentals. Spaces, connections, data tables; begin your first Analytic Model.
- Week 8 — Build the model. Facts, dimensions, a hierarchy, well-named measures. Move one Stage II calculation down into the model.
- Week 9 — Semantics and reuse. Associations, author-once-read-everywhere; read the semantic modeling guide.
- Week 10 — Governed consumption. Connect SAC to your model, build a story on it, read about data products. Stage III artifact due.
- Week 11 — Roles and access. Users, roles, least privilege, open-versus-see, data access controls.
- Week 12 — Lifecycle. Dev to test to production, transport, the rule against building in production; draft the lifecycle note.
- Week 13 — Monitoring. Usage, performance, refresh failures, capacity. Finish the role matrix, lifecycle note, and checklist. Stage IV artifact due.
- Week 14 — Layer ownership and boundaries. Where the semantic layer should live; integration patterns and semantic checkpoints. Start the responsibility map.
- Week 15 — Modernization and synthesis. BW modernize-or-still-fit, then re-read the core platform relationships article. Finish the responsibility map and transition note. Stage V artifact due.
By the end of week fifteen you will have produced, in order, a glossary, two dashboards with rationales, a governed model consumed in SAC, a three-part governance package, and an architectural responsibility map with a transition note. That is not a list of courses watched. It is a body of work — and a body of work, in this field, is what opens the next door.
Core resources by specialization track
The five-stage roadmap is the trunk; specialization tracks are the branches. After Stage II — once you can build a sound story — most people develop a primary direction, and the platform rewards depth in one track far more than thin coverage of all of them. The tracks below map the audiences this site is built for to the route they should take and the proof artifact that confirms they have arrived. Every link points to a page on this site, so each track is a real, walkable path rather than a list of intentions. Pick one primary track. You can borrow from the others, but you should be able to say, in one sentence, which one is yours.
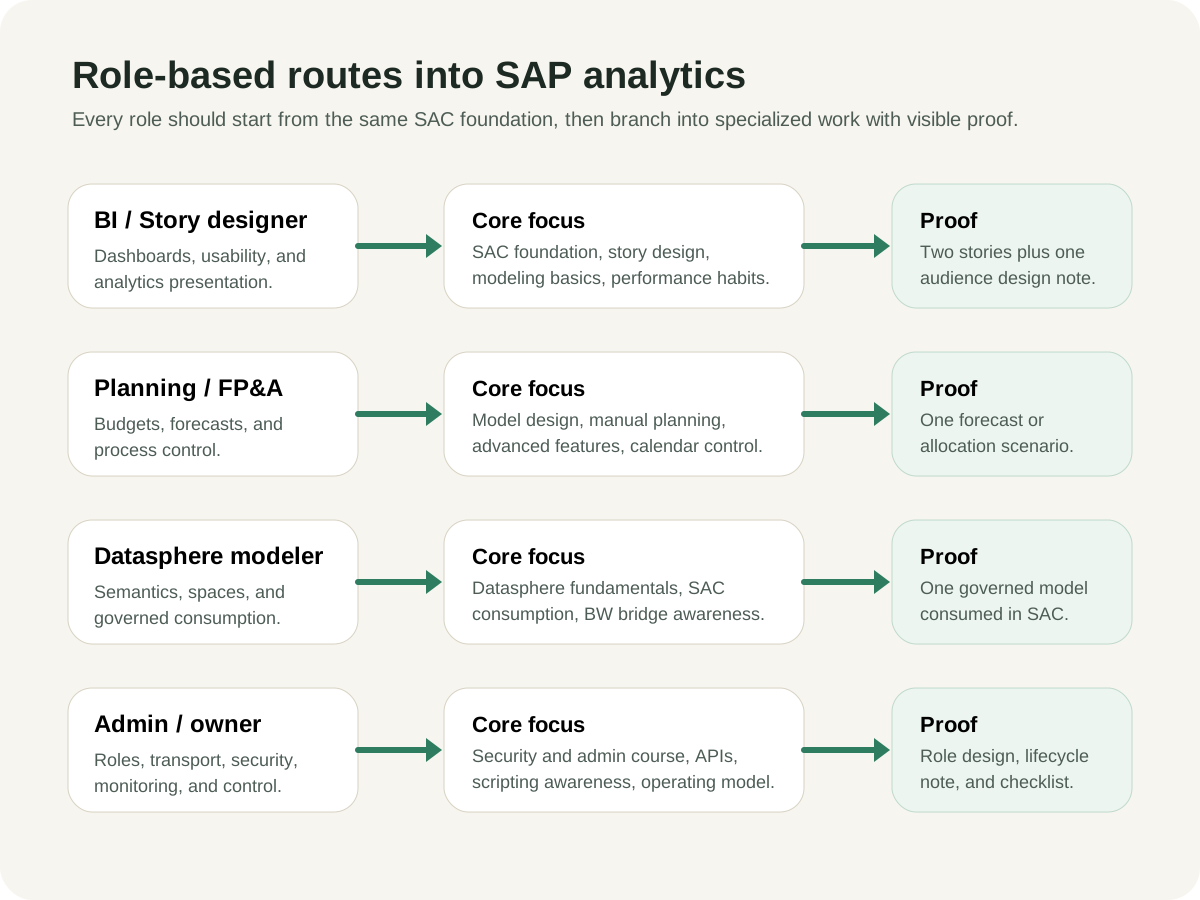
Every role starts from the same SAC foundation, then branches into specialized work with a visible proof artifact. The tracks below extend that picture to the full set of audiences this site serves.
BI / story designer
Your question is "how do I become excellent at reporting, dashboards, and decision surfaces?" Your route runs from the learning path you are reading, into the SAP Analytics Cloud hub, through the comparisons that sharpen judgment about when SAC is the right surface, and into the guide system for hands-on craft. Read SAC versus Power BI and SAC versus Datasphere not to pick a "winner" but to understand what each tool is for; that distinction is what makes a designer's choices defensible. Ground the craft in the SAC data modeling implementation guide, and when you want to see where the discipline is going, read the future of business intelligence in the AI era. Proof artifact: an executive dashboard plus an operational dashboard, each with a written design rationale.
Planning practitioner (FP&A)
Your question is "how do I design planning models and connect them to real operating cycles?" Start in the learning path, go deep on the planning capabilities in the SAC hub and the dedicated planning page, then connect planning to the data foundation through BW modernization and the architecture hub. The skill that distinguishes a real planning practitioner from someone who builds input templates is the link between the model and the operating calendar — versions that mean something, allocations that reflect how the business actually runs, and forecasts that are owned rather than decorative. Proof artifact: a planning model with a version strategy and one working data action or forecast example you can defend.
Datasphere modeler / data-product owner
Your question is "how do I build reusable business meaning and governed consumption?" Your route starts in the Datasphere hub, moves through the architectures that frame where modeling belongs, returns to this learning path for the staged build, and uses the glossary to keep your vocabulary precise. Read the semantic modeling guide and the data products deep dive together, because the modern version of this role is not "I build cubes" but "I publish governed, owned, versioned data products that other teams can trust." When you are ready to build one end to end, follow building your first data product. Proof artifact: a governed semantic model — or a small data-product path — consumed downstream in SAC.
Governance / admin owner
Your question is "how do I keep the tenant, roles, lifecycle, and trust model under control?" Start in the governance, security & admin hub, use the resource center to map official documentation, return to this learning path for the Stage IV build, and lean on the architecture pages to understand how control boundaries are drawn. The Datasphere governance implementation guide and the architecture essay on governance and control boundaries are the spine of this track. The mindset to cultivate: governance is not a gate you add at the end, it is a property you design in from the first model. Proof artifact: a role matrix, a lifecycle note, and a monitoring checklist.
Enterprise architect
Your question is "how do I decide layer ownership, modernization route, and integration boundaries?" Your route is architecture-first: start at the architecture hub, work through the comparisons that force explicit trade-offs, anchor in the flagship topics, and read the core platform relationships article as your reference text. The three architecture essays — where the semantic layer should live, integration versus platform-extension boundaries, and governance and control boundaries — are written specifically for the decisions you own. The discipline that matters most: be able to defend a specific decision against a specific objection, not merely describe a diagram. Proof artifact: a one-page responsibility map and a transition note.
Integration lead
Your question is "how do SAP and non-SAP systems meet without losing meaning or control?" Start in the integrations hub, study the integration patterns, and end in the boundary architecture. The detailed pattern pages — integration patterns, BDC Connect zero-copy integration, integrating data platforms, and integrating enterprise applications — give you the concrete vocabulary, while the essay on integration versus platform-extension boundaries gives you the judgment about where to put a semantic checkpoint. The recurring lesson of this track: data crossing a boundary is easy; meaning crossing a boundary intact is the actual work. Proof artifact: a system-role map and a semantic-checkpoint design note.
AI / analytics innovation lead
Your question is "where does AI belong, and how do I prove value without weakening trust?" Start in the AI in analytics hub, work through the AI workflow and value pages, and frame everything against governance. Read AI workflows, turning AI into ROI, and the AI architecture blueprints, and use the AI readiness assessment to be honest about where an organization actually is. The discipline that separates an innovation lead from an enthusiast is guardrails — knowing that a confident wrong answer from an analytics assistant is worse than no answer, and designing for trust accordingly. The essay the future of business intelligence in the AI era sets the strategic frame. Proof artifact: a use-case brief, rollout guardrails, and an ROI hypothesis.
Executive sponsor / C-suite
Your question is "what matters strategically, what are the risks, and where should investment focus?" Your route is deliberately short and high-altitude: start at the resource center, read the executive guide and the core platform relationships article for the shape of the platform, then use the architectures and comparisons to understand the choices your teams are actually making, finishing with the Business Data Cloud hub for where the commercial model is heading. You do not need to build anything in the tools; you need to ask better questions and recognize a weak answer. Proof artifact: a concise executive briefing naming the risks, the choices, and the next investments.
Free and trial resources to accelerate your learning
You can complete the foundational stages of this roadmap without spending a euro. SAP publishes a large body of free, self-paced learning, full product documentation, and an active practitioner community, and those three sources — used in the right order — will carry you a long way before paid training or books become worthwhile. The discipline that matters here is the order, and the order is drawn below.
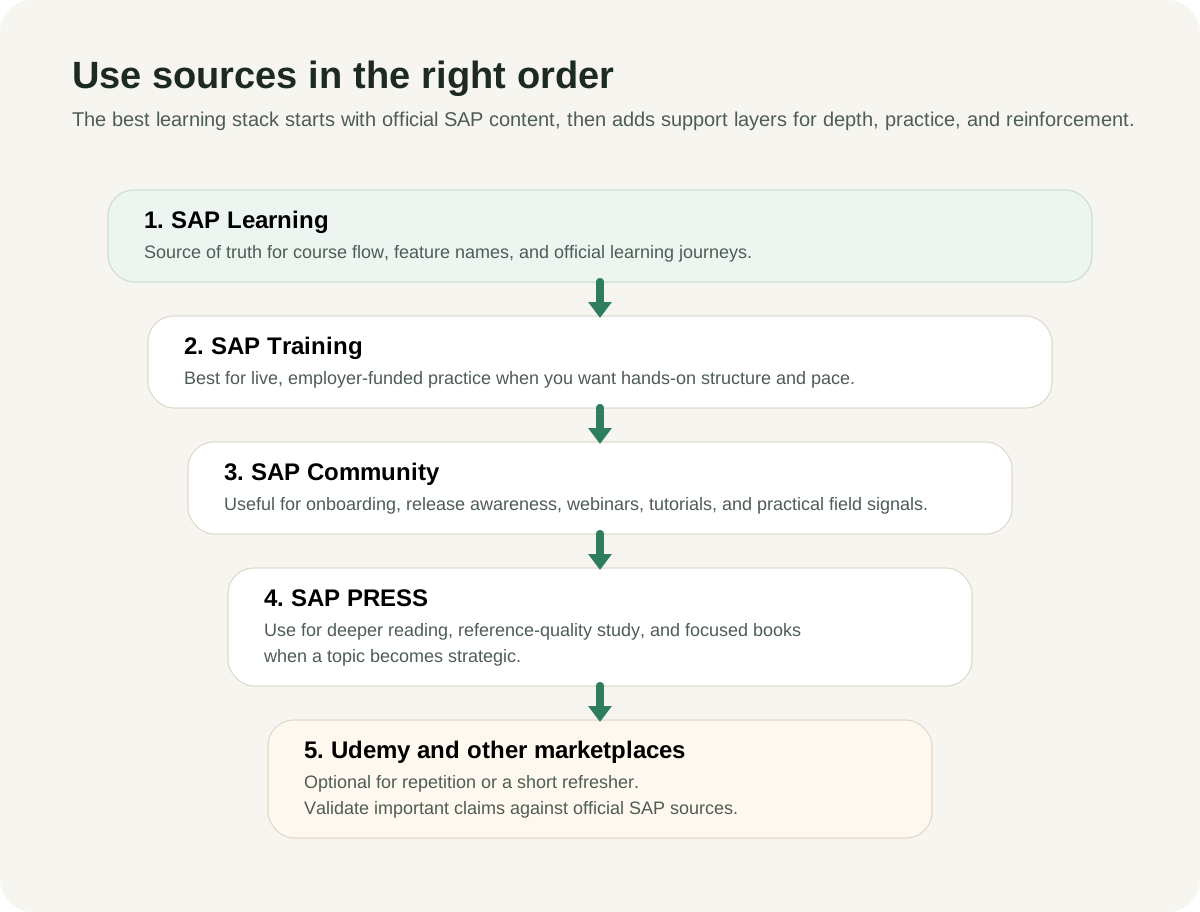
Use sources in the right order: official self-paced learning first, then live training, then community, then books, with general marketplaces last and always validated against official material.
Every external link below has been verified to resolve. I have deliberately kept this list to official SAP landing and documentation surfaces plus this site's own pages, and I have omitted several tempting deep links — individual course slugs that move, third-party training catalog pages, and unofficial video channels — because they break, redirect, or turn out not to be what their name implies. When a resource could not be verified as official and stable, I have pointed you to the relevant page on this site instead. A learning path full of dead links teaches nothing except frustration.
1. Start here — free, self-paced SAP Learning
SAP Learning is the source of truth for course flow, feature names, and official learning journeys, and the foundational analytics content is free. These journeys map almost exactly onto Stages I–III of this roadmap, and each is a genuinely free, self-paced course:
- Exploring SAP Analytics Cloud — the right companion to Stage II. It opens with SAC's place in SAP Business Data Cloud, then covers navigation, data sources and connections, modeling options, basic and advanced stories, planning, augmented analytics, and collaboration. Use it to learn SAC's own names for things.
- Exploring SAP Datasphere — the right companion to Stage III. It covers Datasphere concepts, integrating data from SAP S/4HANA, SAP BW/4HANA, and CSV files, and modeling through inbound, harmonization, and propagation layers up to reporting.
- Introducing SAP Business Data Cloud — a short orientation to the commercial and platform envelope, useful right after the "before you learn anything" section above. For a fuller treatment, the broader Exploring SAP Business Data Cloud journey covers architecture, BW modernization, intelligent applications, and data products.
When you are ready to think about validating your skills with a credential, the Becoming a Certified Data Analyst in SAP Analytics Cloud journey is the structured route to the C_SAC exam—since 2026 a practical, scenario-based assessment rather than multiple choice—and you can browse the full free catalog from the SAP Learning browse page or review credential options at SAP Learning certifications. For how certification fits the roadmap — used to confirm skill, never to replace the portfolio you built in Stages I–V — see this site's certifications page.
2. Official product documentation (when you need the precise answer)
Courses teach you the shape; documentation gives you the exact, current detail. Bookmark the product documentation homes and go to them whenever a course's summary is not precise enough for what you are building:
- SAP Analytics Cloud documentation — the authoritative reference for stories, models, planning, connections, and administration.
- SAP Datasphere documentation — for Spaces, modeling, data access controls, and integration detail.
- SAP Business Data Cloud documentation — for the platform envelope, data products, and BDC Connect.
- SAP BTP documentation — for the runtime everything sits on, useful from Stage IV onward.
For the product story in strategy terms — useful when you are explaining "why this matters" to a stakeholder rather than configuring it — SAP's product pages for SAP Datasphere and SAP Business Data Cloud are concise and current.
3. Community and field signal
SAP Community is where release awareness, tutorials, webinars, and real-world field signals live. It is most useful once you are building and start hitting the specific edge cases that documentation states but does not dramatize — the "why is my refresh failing," "how does this behave with a live connection," "what changed in the latest update" questions. Treat it as a place to learn how practitioners actually work, while validating any high-stakes claim against the official documentation above. SAP also publishes video content through its official SAP Community YouTube channel, a reasonable place to find recorded sessions and walkthroughs.
4. Getting hands-on: trials, free tiers, and practicing without a tenant
Learning analytics without touching a system is like learning to swim from a textbook. You need a place to build, and the good news is that you can get one without a purchase. SAP periodically offers trial and free-tier access to its products, and the foundational SAP Learning courses are built to be followed along interactively, so you can practice the exact tasks each unit demonstrates. Start from the SAP Learning home and the relevant product pages — SAP Datasphere and SAP Business Data Cloud — to find the current trial and guided-experience options, since the precise offers change over time and the official pages are the only reliable place to see what is available today. As of November 2026, they offer a 60-day SAP Analytics Cloud advanced trial in which you connect your own data sources, and 30-day basic trials of SAP Datasphere and SAP Business Data Cloud on shared tenants with sample data.
Whatever environment you get, use it the same way: build small, build often, and rebuild from memory. The single most effective practice habit I know is the "blank-canvas redo" — after a course unit walks you through creating something, close it, open an empty story or model, and recreate the result without looking. The friction you feel doing that is precisely the learning; the smoothness you felt watching the video was an illusion. Three blank-canvas redos teach more than thirty passive viewings, and they convert a vague sense of "I have seen this" into the durable "I can do this" that an artifact requires.
Where a live system genuinely is not available for a particular step — perhaps you cannot get trial access to a specific capability, or your step is conceptual rather than clickable — do not let it stop the stage. Several of this roadmap's proof artifacts are deliberately designed to be produced on paper or in a spreadsheet: the Stage I glossary, the Stage II design rationales, the Stage IV role matrix and lifecycle note, and the entire Stage V responsibility map and transition note. These are thinking artifacts, and the thinking is the scarce skill. The tool mechanics behind them are comparatively quick to pick up once you have access; the discipline of deciding who can see what, how content reaches production, and where meaning must be preserved at a boundary is what takes time to build and what employers actually struggle to find.
5. Books and paid options — later, and deliberately
SAP PRESS and instructor-led SAP Training have their place, but later in the journey and for specific reasons. Reach for a book when a topic becomes strategic for you and you want reference-quality depth; reach for live, instructor-led training when it is employer-funded and you want structured, hands-on pace with an expert in the room. General marketplaces (Udemy and similar) are optional reinforcement — fine for repetition or a quick refresher, but always validate important claims against the official SAP sources above, because third-party material ages and occasionally simply gets things wrong. The ordering on the diagram is the rule: official first, paid practice second, community third, books fourth, general marketplaces last.
Questions beginners ask before they start
A handful of questions come up almost every time someone serious sets out on this path. Answering them up front removes the hesitation that otherwise becomes an excuse not to begin.
"Should I learn SAC or Datasphere first?"
SAC first, without hesitation. You learn the consumption layer before the semantic layer for the same reason you learn to read before you learn to edit: you need to see what good output looks like before you can reason about the foundation that produces it. SAC gives you fast, visible feedback — you build a chart, you see a result, you adjust — and that feedback loop builds momentum and intuition. Datasphere is more abstract and less immediately rewarding; coming to it after SAC, you arrive with concrete questions ("how do I stop rebuilding this revenue logic in every story?") that the semantic layer exists to answer. The roadmap encodes this order deliberately. Resist the temptation, common among engineers, to start "at the bottom of the stack" — for a beginner, that is the slow road.
"Do I need to know SQL?"
Not to start, and not to be a capable BI or planning practitioner. You can go a long way in SAC and even build sound Datasphere models with the graphical tools alone. That said, SQL becomes genuinely useful as you move into Stage III and beyond — it sharpens how you think about joins, granularity, and transformations, and it unlocks more of Datasphere's modeling power. My advice: do not let "I should learn SQL first" delay you for a single day, but do pick up the fundamentals (select, where, group by, joins) in parallel once you reach the modeling stage. It will pay off, and it composes neatly with everything else you are learning rather than competing with it.
"I already know Power BI or Tableau. How much transfers?"
More than you fear and less than you hope. Your data instincts transfer almost entirely — chart selection, audience design, the difference between a measure and a dimension, the smell of a badly shaped dataset. What does not transfer is the platform's distinctive architecture: the hard separation between consumption (SAC) and the governed semantic layer (Datasphere), the planning capability built into the same product as reporting, and the commercial and platform envelope of Business Data Cloud. Crossing over, your fastest wins are in Stage II, where your existing dashboard craft makes you immediately productive. Your real growth is in Stage III, where the semantic-layer discipline is likely stronger and more central than in the stack you came from. Lean into that difference rather than trying to make SAP behave like your old tool; the people who struggle most are the ones who keep reaching for the previous platform's mental model.
"Is it worth learning if SAP keeps renaming and rebundling things?"
Yes — and the churn is exactly why you should learn the way this roadmap teaches. Names and packaging change (Data Warehouse Cloud became Datasphere; just ask now also powers analytical insights in Joule; SAC and Datasphere are now licensed through Business Data Cloud), but the underlying disciplines do not. There will always be a consumption layer, a place where business meaning is defined, a security and lifecycle model, and integration boundaries where meaning must be preserved. Learn those as concepts and the renamings become trivia you update in an afternoon. The practitioners who panic at every rebrand are the ones who learned features by rote; the ones who learned the architecture barely notice. Build your understanding on the layer that does not move, and the moving parts stop being threatening.
"How long until I am employable or useful at work?"
You become genuinely useful at the consumption layer — able to build dashboards a team relies on — by the end of Stage II, which is a matter of weeks of focused effort, not months. You become valuable in a deeper, harder-to-replace way as you complete Stages III and IV, because understanding the semantic layer and the governance model is what separates a dashboard-builder from someone an organization trusts with its analytics foundation. The portfolio you accumulate along the way is what makes this legible to others: three or four artifacts you can show and defend are worth more in a conversation than any list of courses or even a certification on its own. Build the artifacts, keep them, and be ready to walk someone through your thinking on each. That readiness is what gets believed.
Putting it together: your first fifteen weeks
Here is the whole path in one breath, so you can hold it in your head. Weeks 1–2: get the vocabulary and the three-layer model straight, and write your own glossary. Weeks 3–6: become genuinely good at SAC stories and dashboards, and learn what planning actually is, ending with an executive dashboard and an operational dashboard you can defend. Weeks 7–10: move into Datasphere, build a governed model, and consume it from SAC so the loop closes in your own hands. Weeks 11–13: learn security, lifecycle, and monitoring, and produce a role matrix, a lifecycle note, and a monitoring checklist. Weeks 14–15: step up to architecture, and produce a responsibility map and a transition note. Along the way, pick one specialization track and take it to its proof artifact.
If you do this, in this order, you will end the fifteen weeks with something most self-taught practitioners never have: a coherent mental model, a portfolio of real artifacts, and the judgment to know which layer a problem belongs in. That last thing — judgment — is what the whole sequence is for. Tools change, branding changes, packaging changes; the discipline of building on shared meaning, securing it, operating it, and knowing where it should live does not. Learn the discipline, and the tools become details. Then keep going — re-read the core platform relationships article, deepen your chosen track, and let the next problem teach you the next thing.